Complete financial analysis of Venture Minerals Limited (VTMLF) income statement, including revenue, profit margins, EPS and key performance metrics. Get detailed insights into the financial performance of Venture Minerals Limited, a leading company in the Industrial Materials industry within the Basic Materials sector.
- Unbanked,Inc. (8746.T) Income Statement Analysis – Financial Results
- African Gold Acquisition Corporation (AGAC) Income Statement Analysis – Financial Results
- Shihlin Paper Corporation (1903.TW) Income Statement Analysis – Financial Results
- AES Brasil Energia S.A. (AESB3.SA) Income Statement Analysis – Financial Results
- Grounded People Apparel Inc. (SHOE.CN) Income Statement Analysis – Financial Results
Venture Minerals Limited (VTMLF)
About Venture Minerals Limited
Venture Minerals Limited engages in the mineral exploration and development business in Australia. The company explores for nickel, iron, cobalt, tin, tungsten, copper, silver, gold, lead, zinc, and PGE deposits. Its flagship project is the 100% owned Mount Lindsay project that covers an area of approximately 159 square kilometers located in north-western Tasmania. Venture Minerals Limited was incorporated in 2006 and is based in West Perth, Australia.
| Metric | 2023 | 2022 | 2021 | 2020 | 2019 | 2018 | 2017 | 2016 | 2015 | 2014 | 2013 | 2012 | 2011 | 2010 | 2009 | 2008 | 2007 |
|---|---|---|---|---|---|---|---|---|---|---|---|---|---|---|---|---|---|
| Revenue | 94.93K | 8.09K | 6.22K | 14.49K | 23.84K | 35.35K | 220.69K | 150.23K | 174.73K | 327.49K | 679.95K | 0.00 | 0.00 | 0.00 | 0.00 | 0.00 | 0.00 |
| Cost of Revenue | 0.00 | 81.31K | 27.32K | 14.71K | 16.78K | 30.09K | 75.57K | 44.63K | 0.00 | 0.00 | 0.00 | 0.00 | 0.00 | 0.00 | 0.00 | 0.00 | 0.00 |
| Gross Profit | 94.93K | -73.22K | -21.10K | -216.00 | 7.05K | 5.26K | 145.13K | 105.60K | 174.73K | 327.49K | 679.95K | 0.00 | 0.00 | 0.00 | 0.00 | 0.00 | 0.00 |
| Gross Profit Ratio | 100.00% | -905.01% | -339.18% | -1.49% | 29.59% | 14.89% | 65.76% | 70.29% | 100.00% | 100.00% | 100.00% | 0.00% | 0.00% | 0.00% | 0.00% | 0.00% | 0.00% |
| Research & Development | 0.00 | 0.00 | 0.00 | 0.00 | 0.00 | 0.00 | 0.00 | 0.00 | 0.00 | 0.00 | 0.00 | 0.00 | 0.00 | 0.00 | 0.00 | 0.00 | 0.00 |
| General & Administrative | 1.75M | 1.56M | 856.33K | 446.16K | 1.01M | 799.53K | 478.49K | 1.15M | 1.34M | 2.15M | 3.32M | 3.85M | 4.27M | 2.27M | 1.74M | 1.95M | 843.03K |
| Selling & Marketing | 6.88M | 5.07M | 1.52M | 696.64K | 2.33M | 2.21M | 119.95K | 153.42K | 390.49K | 657.57K | 852.88K | 707.27K | 501.92K | 268.49K | 237.78K | 82.60K | 91.87K |
| SG&A | 8.48M | 6.62M | 2.38M | 1.14M | 1.28M | 1.06M | 703.16K | 1.40M | 1.34M | 2.15M | 3.32M | 3.85M | 4.27M | 2.27M | 1.74M | 1.95M | 843.03K |
| Other Expenses | 24.56K | 5.07K | 51.44K | 50.00K | 35.82K | 4.78K | 176.30K | 254.60K | 0.00 | 0.00 | 1.16M | 1.01M | 853.78K | 394.35K | 1.60K | 6.30K | 199.02K |
| Operating Expenses | 9.20M | 6.62M | 2.38M | 1.14M | 1.28M | 1.06M | 703.16K | 1.40M | 3.50M | 5.80M | 5.34M | 5.56M | 5.63M | 2.94M | 3.74M | 2.19M | 1.13M |
| Cost & Expenses | 9.20M | 6.71M | 2.41M | 1.16M | 1.30M | 1.09M | 778.73K | 1.45M | 2.70M | 7.48M | 5.34M | 5.56M | 5.63M | 2.94M | 3.74M | 2.19M | 1.13M |
| Interest Income | 94.93K | 8.09K | 6.22K | 14.49K | 23.84K | 30.57K | 44.39K | 93.61K | 174.73K | 327.49K | 679.95K | 751.43K | 1.07M | 305.97K | 105.37K | 163.11K | 120.45K |
| Interest Expense | 27.18K | 34.14K | 25.91K | 25.01K | 13.35K | 14.15K | 17.56K | 27.26K | 1.82K | 5.03K | 227.82K | 11.89K | 8.92K | 0.00 | 0.00 | 5.02K | 3.13K |
| Depreciation & Amortization | 75.82K | 81.31K | 27.32K | 14.71K | 16.78K | 30.09K | 75.57K | 44.63K | 65.15K | 55.60K | 39.37K | 46.85K | 49.73K | 19.85K | 20.74K | 15.99K | 2.27K |
| EBITDA | -9.01M | -6.62M | -2.38M | -1.14M | -1.28M | -1.06M | -703.16K | -1.40M | -3.43M | -5.67M | -4.62M | -4.76M | -4.50M | -2.92M | -3.71M | -2.00M | -1.01M |
| EBITDA Ratio | -9,489.91% | -81,886.53% | -38,283.28% | -7,886.75% | -5,367.22% | -2,985.71% | -318.61% | -934.29% | -1,963.85% | -1,731.30% | -679.33% | 0.00% | 0.00% | 0.00% | 0.00% | 0.00% | 0.00% |
| Operating Income | -8.98M | -6.71M | -2.41M | -1.16M | -1.30M | -1.09M | -778.73K | -1.45M | -2.42M | -6.98M | -5.34M | -5.56M | -5.63M | -2.94M | -3.74M | -2.19M | -1.13M |
| Operating Income Ratio | -9,456.12% | -82,891.59% | -38,722.51% | -7,988.27% | -5,437.62% | -3,070.84% | -352.86% | -964.00% | -1,386.77% | -2,132.23% | -785.12% | 0.00% | 0.00% | 0.00% | 0.00% | 0.00% | 0.00% |
| Total Other Income/Expenses | -135.08K | -4.73M | -148.37K | -62.18K | 98.28K | -894.03K | -81.31K | -885.12K | -897.94K | -164.61K | -451.01K | -45.95K | 384.72K | 305.97K | -1.57M | 164.38K | -15.29K |
| Income Before Tax | -9.11M | -17.76M | -11.75M | -2.20M | -2.84M | -3.51M | -1.78M | -3.52M | -3.32M | -5.54M | -4.89M | -4.82M | -4.56M | -2.63M | -3.63M | -2.02M | -1.02M |
| Income Before Tax Ratio | -9,598.41% | -219,496.16% | -188,908.02% | -15,214.35% | -11,897.00% | -9,932.86% | -807.89% | -2,341.78% | -1,900.69% | -1,692.09% | -718.63% | 0.00% | 0.00% | 0.00% | 0.00% | 0.00% | 0.00% |
| Income Tax Expense | 0.00 | 5.00 | 3.00 | 4.00 | 147.25K | 5.00 | 3.00 | -197.98K | -793.92K | -1.42M | -1.71M | -867.26K | -431.78K | -331.41K | -244.57K | 11.32K | -88.74K |
| Net Income | -9.11M | -17.76M | -11.75M | -2.20M | -2.98M | -3.51M | -1.78M | -3.32M | -2.53M | -4.12M | -3.17M | -3.96M | -4.13M | -2.30M | -3.38M | -2.02M | -1.02M |
| Net Income Ratio | -9,598.41% | -219,496.16% | -188,908.02% | -15,214.35% | -12,514.78% | -9,932.86% | -807.89% | -2,209.99% | -1,446.30% | -1,259.44% | -466.82% | 0.00% | 0.00% | 0.00% | 0.00% | 0.00% | 0.00% |
| EPS | -0.01 | -0.01 | -0.01 | 0.00 | -0.01 | -0.01 | -0.01 | -0.01 | -0.01 | -0.01 | -0.01 | -0.02 | -0.02 | -0.01 | -0.04 | -0.04 | -0.02 |
| EPS Diluted | -0.01 | -0.01 | -0.01 | 0.00 | -0.01 | -0.01 | -0.01 | -0.01 | -0.01 | -0.01 | -0.01 | -0.02 | -0.02 | -0.01 | -0.04 | -0.04 | -0.02 |
| Weighted Avg Shares Out | 1.75B | 1.51B | 1.10B | 807.31M | 529.92M | 421.46M | 335.89M | 318.06M | 301.69M | 301.69M | 276.61M | 237.45M | 212.89M | 154.20M | 90.02M | 57.07M | 42.47M |
| Weighted Avg Shares Out (Dil) | 1.75B | 1.51B | 1.10B | 807.31M | 529.92M | 421.46M | 335.89M | 318.06M | 301.69M | 301.69M | 290.44M | 237.45M | 212.89M | 154.20M | 90.02M | 57.07M | 42.47M |

Venture Minerals on path to develop Mount Lindsay Tin-Tungsten Project with underground mine feasibility study underway
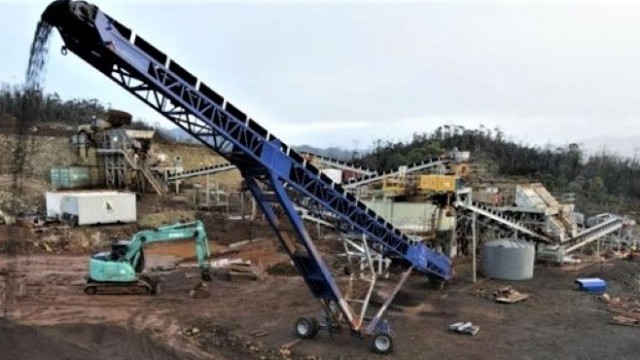
Venture Minerals makes strong progress over 2021 financial year
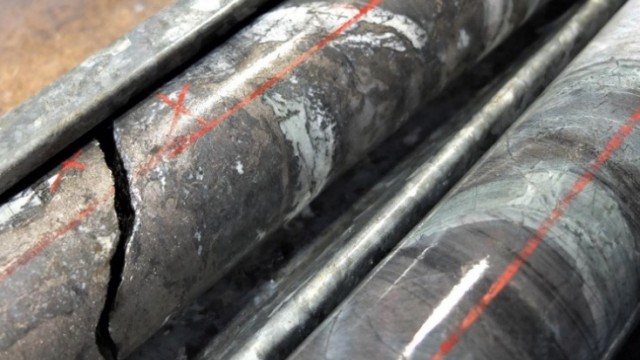
Venture Minerals unearths potential new discovery at one of world's largest undeveloped tin projects
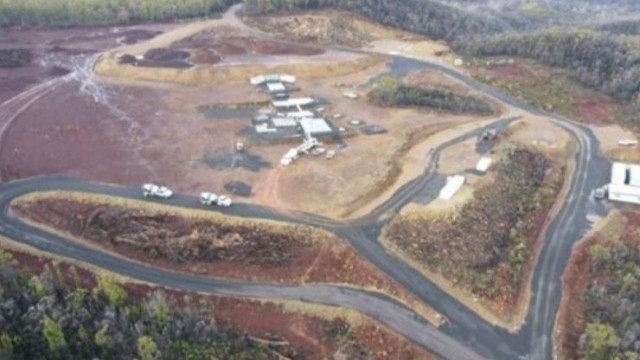
'External market volatility beyond the company's control' - iron ore miner halts shipments
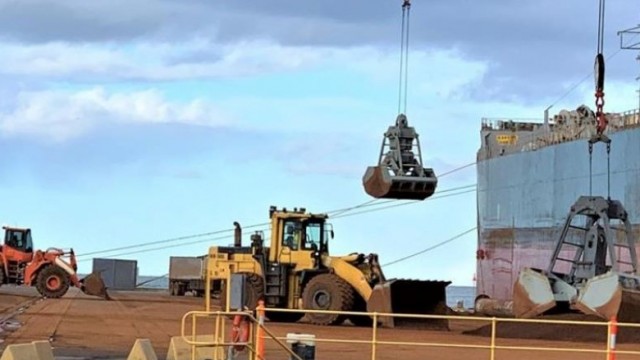
Venture Minerals completes first commercial shipment from Riley Iron Ore Mine
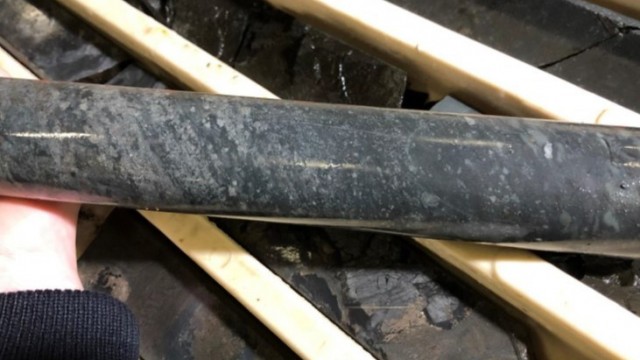
Venture Minerals discovers large mineralised skarn along strike from high-grade Renison Bell Tin Mine
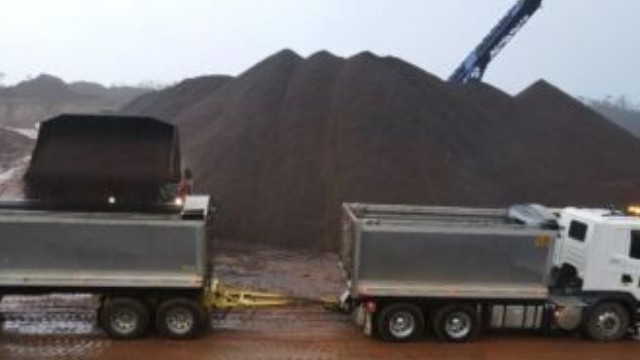
Venture Minerals receives Tasmanian EPA approval for 24-hour iron ore trucking

Venture Minerals enters an exciting phase as it moves from explorer to producer
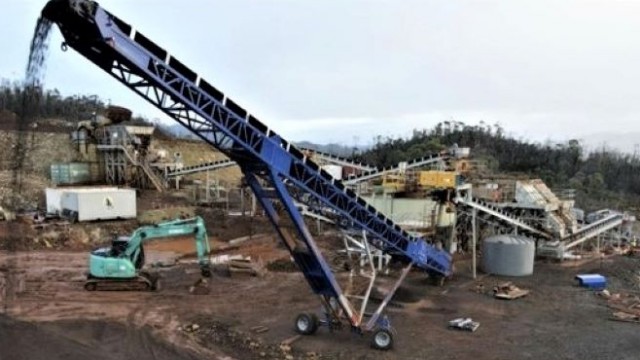
Venture Minerals will send off first iron ore shipment in early September, shares up

Venture Minerals doubles nickel-copper-PGE portfolio with new tenure at Kulin Project in Western Australia
Source: https://incomestatements.info
Category: Stock Reports
