See more : Canadian Imperial Bank of Commerce (CM.TO) Income Statement Analysis – Financial Results
Complete financial analysis of Venture Minerals Limited (VTMLF) income statement, including revenue, profit margins, EPS and key performance metrics. Get detailed insights into the financial performance of Venture Minerals Limited, a leading company in the Industrial Materials industry within the Basic Materials sector.
- Tips Industries Limited (TIPSINDLTD.BO) Income Statement Analysis – Financial Results
- Kridhan Infra Limited (KRIINFRA.BO) Income Statement Analysis – Financial Results
- UEKI Corporation (1867.T) Income Statement Analysis – Financial Results
- Maruzen Showa Unyu Co., Ltd. (9068.T) Income Statement Analysis – Financial Results
- Remsons Industries Limited (REMSONSIND.NS) Income Statement Analysis – Financial Results
Venture Minerals Limited (VTMLF)
About Venture Minerals Limited
Venture Minerals Limited engages in the mineral exploration and development business in Australia. The company explores for nickel, iron, cobalt, tin, tungsten, copper, silver, gold, lead, zinc, and PGE deposits. Its flagship project is the 100% owned Mount Lindsay project that covers an area of approximately 159 square kilometers located in north-western Tasmania. Venture Minerals Limited was incorporated in 2006 and is based in West Perth, Australia.
| Metric | 2023 | 2022 | 2021 | 2020 | 2019 | 2018 | 2017 | 2016 | 2015 | 2014 | 2013 | 2012 | 2011 | 2010 | 2009 | 2008 | 2007 |
|---|---|---|---|---|---|---|---|---|---|---|---|---|---|---|---|---|---|
| Revenue | 94.93K | 8.09K | 6.22K | 14.49K | 23.84K | 35.35K | 220.69K | 150.23K | 174.73K | 327.49K | 679.95K | 0.00 | 0.00 | 0.00 | 0.00 | 0.00 | 0.00 |
| Cost of Revenue | 0.00 | 81.31K | 27.32K | 14.71K | 16.78K | 30.09K | 75.57K | 44.63K | 0.00 | 0.00 | 0.00 | 0.00 | 0.00 | 0.00 | 0.00 | 0.00 | 0.00 |
| Gross Profit | 94.93K | -73.22K | -21.10K | -216.00 | 7.05K | 5.26K | 145.13K | 105.60K | 174.73K | 327.49K | 679.95K | 0.00 | 0.00 | 0.00 | 0.00 | 0.00 | 0.00 |
| Gross Profit Ratio | 100.00% | -905.01% | -339.18% | -1.49% | 29.59% | 14.89% | 65.76% | 70.29% | 100.00% | 100.00% | 100.00% | 0.00% | 0.00% | 0.00% | 0.00% | 0.00% | 0.00% |
| Research & Development | 0.00 | 0.00 | 0.00 | 0.00 | 0.00 | 0.00 | 0.00 | 0.00 | 0.00 | 0.00 | 0.00 | 0.00 | 0.00 | 0.00 | 0.00 | 0.00 | 0.00 |
| General & Administrative | 1.75M | 1.56M | 856.33K | 446.16K | 1.01M | 799.53K | 478.49K | 1.15M | 1.34M | 2.15M | 3.32M | 3.85M | 4.27M | 2.27M | 1.74M | 1.95M | 843.03K |
| Selling & Marketing | 6.88M | 5.07M | 1.52M | 696.64K | 2.33M | 2.21M | 119.95K | 153.42K | 390.49K | 657.57K | 852.88K | 707.27K | 501.92K | 268.49K | 237.78K | 82.60K | 91.87K |
| SG&A | 8.48M | 6.62M | 2.38M | 1.14M | 1.28M | 1.06M | 703.16K | 1.40M | 1.34M | 2.15M | 3.32M | 3.85M | 4.27M | 2.27M | 1.74M | 1.95M | 843.03K |
| Other Expenses | 24.56K | 5.07K | 51.44K | 50.00K | 35.82K | 4.78K | 176.30K | 254.60K | 0.00 | 0.00 | 1.16M | 1.01M | 853.78K | 394.35K | 1.60K | 6.30K | 199.02K |
| Operating Expenses | 9.20M | 6.62M | 2.38M | 1.14M | 1.28M | 1.06M | 703.16K | 1.40M | 3.50M | 5.80M | 5.34M | 5.56M | 5.63M | 2.94M | 3.74M | 2.19M | 1.13M |
| Cost & Expenses | 9.20M | 6.71M | 2.41M | 1.16M | 1.30M | 1.09M | 778.73K | 1.45M | 2.70M | 7.48M | 5.34M | 5.56M | 5.63M | 2.94M | 3.74M | 2.19M | 1.13M |
| Interest Income | 94.93K | 8.09K | 6.22K | 14.49K | 23.84K | 30.57K | 44.39K | 93.61K | 174.73K | 327.49K | 679.95K | 751.43K | 1.07M | 305.97K | 105.37K | 163.11K | 120.45K |
| Interest Expense | 27.18K | 34.14K | 25.91K | 25.01K | 13.35K | 14.15K | 17.56K | 27.26K | 1.82K | 5.03K | 227.82K | 11.89K | 8.92K | 0.00 | 0.00 | 5.02K | 3.13K |
| Depreciation & Amortization | 75.82K | 81.31K | 27.32K | 14.71K | 16.78K | 30.09K | 75.57K | 44.63K | 65.15K | 55.60K | 39.37K | 46.85K | 49.73K | 19.85K | 20.74K | 15.99K | 2.27K |
| EBITDA | -9.01M | -6.62M | -2.38M | -1.14M | -1.28M | -1.06M | -703.16K | -1.40M | -3.43M | -5.67M | -4.62M | -4.76M | -4.50M | -2.92M | -3.71M | -2.00M | -1.01M |
| EBITDA Ratio | -9,489.91% | -81,886.53% | -38,283.28% | -7,886.75% | -5,367.22% | -2,985.71% | -318.61% | -934.29% | -1,963.85% | -1,731.30% | -679.33% | 0.00% | 0.00% | 0.00% | 0.00% | 0.00% | 0.00% |
| Operating Income | -8.98M | -6.71M | -2.41M | -1.16M | -1.30M | -1.09M | -778.73K | -1.45M | -2.42M | -6.98M | -5.34M | -5.56M | -5.63M | -2.94M | -3.74M | -2.19M | -1.13M |
| Operating Income Ratio | -9,456.12% | -82,891.59% | -38,722.51% | -7,988.27% | -5,437.62% | -3,070.84% | -352.86% | -964.00% | -1,386.77% | -2,132.23% | -785.12% | 0.00% | 0.00% | 0.00% | 0.00% | 0.00% | 0.00% |
| Total Other Income/Expenses | -135.08K | -4.73M | -148.37K | -62.18K | 98.28K | -894.03K | -81.31K | -885.12K | -897.94K | -164.61K | -451.01K | -45.95K | 384.72K | 305.97K | -1.57M | 164.38K | -15.29K |
| Income Before Tax | -9.11M | -17.76M | -11.75M | -2.20M | -2.84M | -3.51M | -1.78M | -3.52M | -3.32M | -5.54M | -4.89M | -4.82M | -4.56M | -2.63M | -3.63M | -2.02M | -1.02M |
| Income Before Tax Ratio | -9,598.41% | -219,496.16% | -188,908.02% | -15,214.35% | -11,897.00% | -9,932.86% | -807.89% | -2,341.78% | -1,900.69% | -1,692.09% | -718.63% | 0.00% | 0.00% | 0.00% | 0.00% | 0.00% | 0.00% |
| Income Tax Expense | 0.00 | 5.00 | 3.00 | 4.00 | 147.25K | 5.00 | 3.00 | -197.98K | -793.92K | -1.42M | -1.71M | -867.26K | -431.78K | -331.41K | -244.57K | 11.32K | -88.74K |
| Net Income | -9.11M | -17.76M | -11.75M | -2.20M | -2.98M | -3.51M | -1.78M | -3.32M | -2.53M | -4.12M | -3.17M | -3.96M | -4.13M | -2.30M | -3.38M | -2.02M | -1.02M |
| Net Income Ratio | -9,598.41% | -219,496.16% | -188,908.02% | -15,214.35% | -12,514.78% | -9,932.86% | -807.89% | -2,209.99% | -1,446.30% | -1,259.44% | -466.82% | 0.00% | 0.00% | 0.00% | 0.00% | 0.00% | 0.00% |
| EPS | -0.01 | -0.01 | -0.01 | 0.00 | -0.01 | -0.01 | -0.01 | -0.01 | -0.01 | -0.01 | -0.01 | -0.02 | -0.02 | -0.01 | -0.04 | -0.04 | -0.02 |
| EPS Diluted | -0.01 | -0.01 | -0.01 | 0.00 | -0.01 | -0.01 | -0.01 | -0.01 | -0.01 | -0.01 | -0.01 | -0.02 | -0.02 | -0.01 | -0.04 | -0.04 | -0.02 |
| Weighted Avg Shares Out | 1.75B | 1.51B | 1.10B | 807.31M | 529.92M | 421.46M | 335.89M | 318.06M | 301.69M | 301.69M | 276.61M | 237.45M | 212.89M | 154.20M | 90.02M | 57.07M | 42.47M |
| Weighted Avg Shares Out (Dil) | 1.75B | 1.51B | 1.10B | 807.31M | 529.92M | 421.46M | 335.89M | 318.06M | 301.69M | 301.69M | 290.44M | 237.45M | 212.89M | 154.20M | 90.02M | 57.07M | 42.47M |
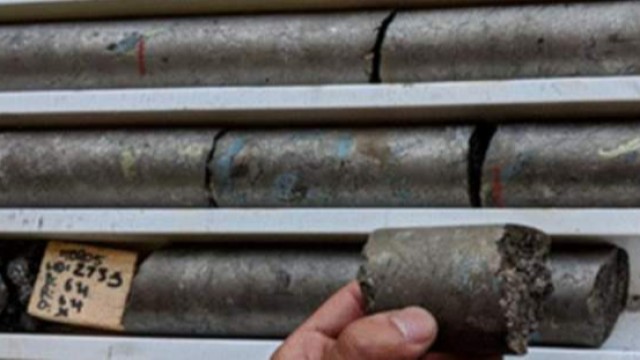
Venture Minerals encouraged as Chalice Mining defines new EM anomalies at ‘Julimar lookalike'
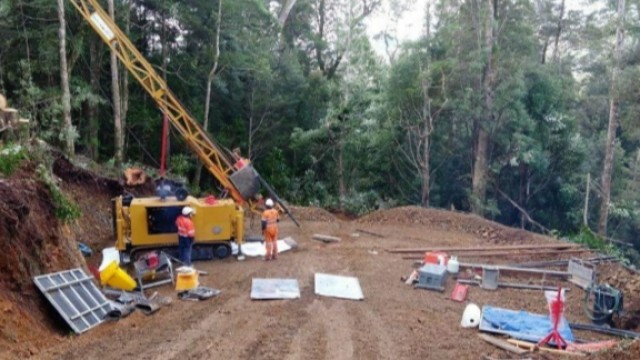
Venture Minerals has drill spinning on priority tin target at Mount Lindsay Project in Tasmania
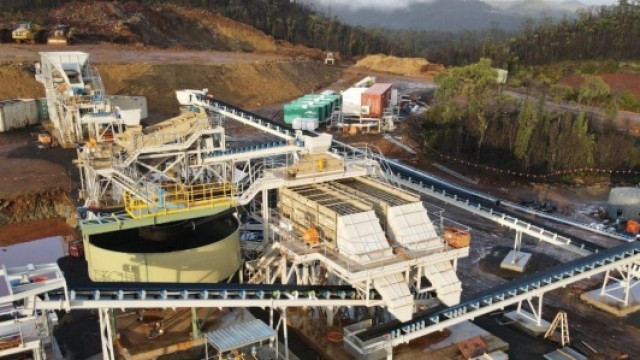
Venture Minerals begins Riley Iron Ore Mine plant commissioning with first shipment on track this quarter
Venture Minerals' partner Chalice Mining begins on-ground exploration at Julimar lookalike
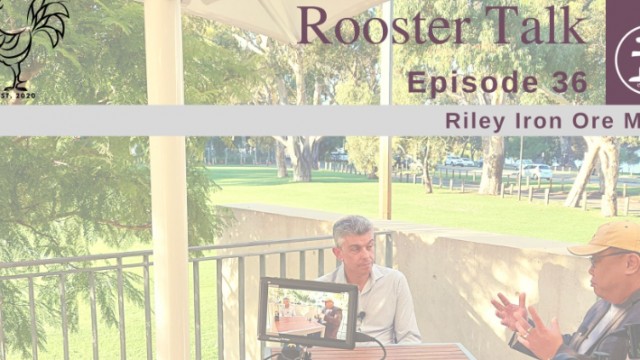
Rooster Talk: Adding more pieces to the Holy Grail - Venture Minerals
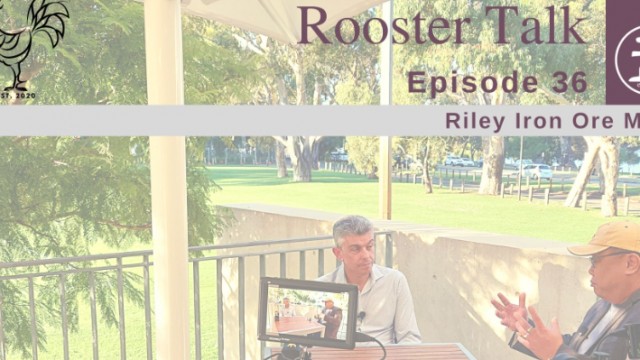
Coffee with Samso: Adding more pieces to the Holy Grail - Venture Minerals
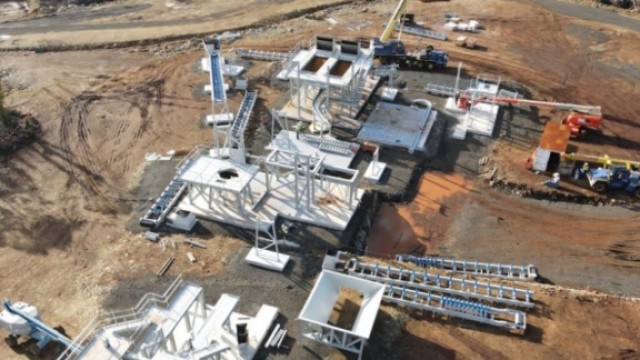
Venture Minerals plant construction on schedule at Riley Iron Ore Project with commissioning to start in two weeks
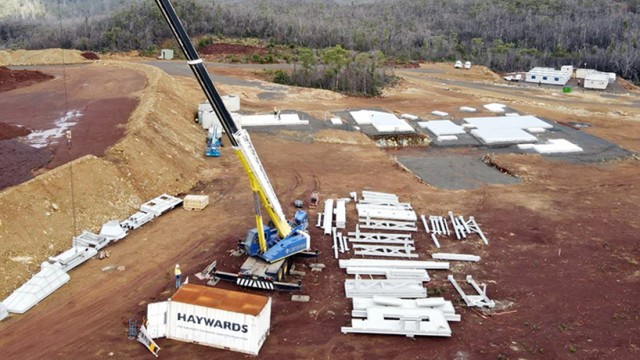
Venture Minerals begins installing Wet Screening Plant at Riley Iron Ore Mine and strengthens team

Venture Minerals in at-the-market subscription agreement with Acuity Capital for up to A$10 million of standby equity capital
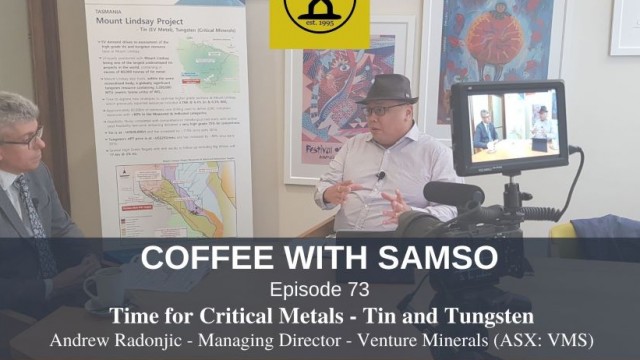
Coffee with Samso: Time for critical metals, tin and tungsten - Venture Minerals
Source: https://incomestatements.info
Category: Stock Reports
