See more : Sirius Real Estate Limited (SRE.L) Income Statement Analysis – Financial Results
Complete financial analysis of United States Steel Corporation (X) income statement, including revenue, profit margins, EPS and key performance metrics. Get detailed insights into the financial performance of United States Steel Corporation, a leading company in the Steel industry within the Basic Materials sector.
- Kolibri Global Energy Inc. (KGEI) Income Statement Analysis – Financial Results
- Novavax, Inc. (NVV1.F) Income Statement Analysis – Financial Results
- 4C Group AB (publ) (4C.ST) Income Statement Analysis – Financial Results
- PT Megapower Makmur Tbk (MPOW.JK) Income Statement Analysis – Financial Results
- National Fertilizers Limited (NFL.NS) Income Statement Analysis – Financial Results
United States Steel Corporation (X)
About United States Steel Corporation
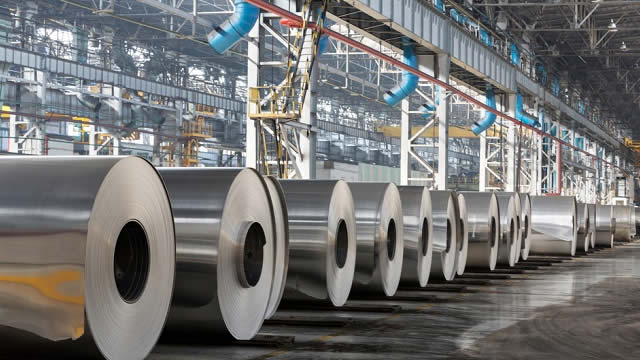
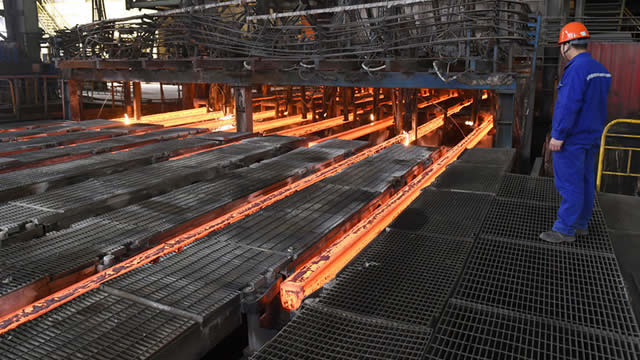
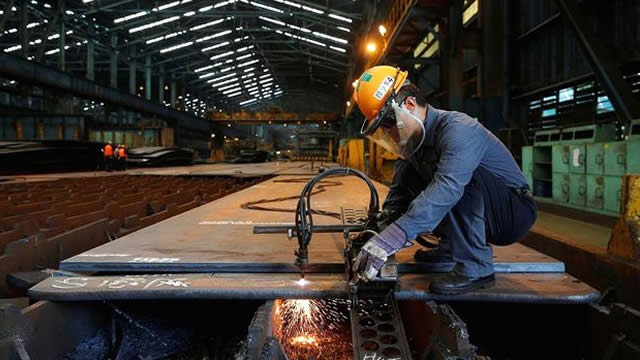
United States Steel Corporation produces and sells flat-rolled and tubular steel products primarily in North America and Europe. It operates through four segments: North American Flat-Rolled (Flat-Rolled), Mini Mill, U. S. Steel Europe (USSE), and Tubular Products (Tubular). The Flat-Rolled segment offers slabs, strip mill plates, sheets, and tin mill products, as well as iron ore and coke. This segment serves customers in the service center, conversion, transportation, automotive, construction, container, appliance, and electrical markets. The Mini Mill segment provides hot-rolled, cold-rolled, and coated sheets and electrical products. This segment serves customers in the automotive, appliance, construction, container, transportation, and service center markets. The USSE segment provides slabs, strip mill plates, sheets, tin mill products, and spiral welded pipes. This segment serves customers in the construction, container, appliance and electrical, service center, conversion, oil, gas, and petrochemical markets. The Tubular segment offers seamless and electric resistance welded steel casing and tubing products, as well as standard and line pipe and mechanical tubing products primarily to customers in the oil, gas, and petrochemical markets. The company also engages in the real estate business. United States Steel Corporation was founded in 1901 and is headquartered in Pittsburgh, Pennsylvania.
| Metric | 2023 | 2022 | 2021 | 2020 | 2019 | 2018 | 2017 | 2016 | 2015 | 2014 | 2013 | 2012 | 2011 | 2010 | 2009 | 2008 | 2007 | 2006 | 2005 | 2004 | 2003 | 2002 | 2001 | 2000 | 1999 | 1998 | 1997 | 1996 | 1995 | 1994 | 1993 | 1992 | 1991 | 1990 |
|---|---|---|---|---|---|---|---|---|---|---|---|---|---|---|---|---|---|---|---|---|---|---|---|---|---|---|---|---|---|---|---|---|---|---|
| Revenue | 18.05B | 21.07B | 20.28B | 9.74B | 12.94B | 14.18B | 12.25B | 10.26B | 11.57B | 17.51B | 17.42B | 19.33B | 19.88B | 17.37B | 11.05B | 23.82B | 16.87B | 15.72B | 14.04B | 13.97B | 9.33B | 6.95B | 6.29B | 6.13B | 5.38B | 6.18B | 6.81B | 6.55B | 6.46B | 6.07B | 5.61B | 4.95B | 4.86B | 6.07B |
| Cost of Revenue | 15.80B | 16.78B | 14.53B | 9.56B | 12.08B | 12.31B | 10.86B | 9.62B | 11.14B | 15.45B | 16.02B | 17.63B | 18.34B | 16.26B | 11.60B | 19.78B | 14.63B | 12.97B | 11.60B | 11.41B | 8.47B | 6.16B | 6.09B | 5.66B | 4.93B | 5.41B | 5.76B | 5.83B | 5.57B | 5.34B | 4.96B | 4.78B | 5.23B | 5.32B |
| Gross Profit | 2.25B | 4.29B | 5.74B | 183.00M | 855.00M | 1.87B | 1.39B | 638.00M | 433.00M | 2.06B | 1.41B | 1.70B | 1.54B | 1.12B | -549.00M | 4.04B | 2.24B | 2.75B | 2.44B | 2.56B | 859.00M | 791.00M | 195.00M | 476.00M | 452.00M | 774.00M | 1.05B | 718.00M | 891.00M | 724.00M | 650.00M | 171.00M | -364.00M | 753.00M |
| Gross Profit Ratio | 12.46% | 20.36% | 28.32% | 1.88% | 6.61% | 13.21% | 11.31% | 6.22% | 3.74% | 11.76% | 8.08% | 8.79% | 7.75% | 6.42% | -4.97% | 16.95% | 13.28% | 17.48% | 17.37% | 18.34% | 9.21% | 11.38% | 3.10% | 7.76% | 8.40% | 12.52% | 15.44% | 10.97% | 13.80% | 11.94% | 11.58% | 3.46% | -7.48% | 12.40% |
| Research & Development | 0.00 | 0.00 | 0.00 | 0.00 | 0.00 | 0.00 | 0.00 | 0.00 | 0.00 | 0.00 | 0.00 | 0.00 | 0.00 | 0.00 | 0.00 | 0.00 | 0.00 | 0.00 | 0.00 | 0.00 | 0.00 | 0.00 | 0.00 | 0.00 | 0.00 | 0.00 | 0.00 | 0.00 | 0.00 | 0.00 | 0.00 | 0.00 | 0.00 | 0.00 |
| General & Administrative | 0.00 | 0.00 | 0.00 | 0.00 | 0.00 | 336.00M | 375.00M | 255.00M | 415.00M | 523.00M | 610.00M | 654.00M | 733.00M | 610.00M | 618.00M | 625.00M | 589.00M | 604.00M | 698.00M | 739.00M | 673.00M | 418.00M | 0.00 | 0.00 | 0.00 | 0.00 | 0.00 | 0.00 | 0.00 | 0.00 | 0.00 | 0.00 | 0.00 | 0.00 |
| Selling & Marketing | 0.00 | 0.00 | 0.00 | 0.00 | 0.00 | 0.00 | 0.00 | 0.00 | -26.00M | 0.00 | 0.00 | 0.00 | 0.00 | 0.00 | 0.00 | -6.00M | 0.00 | 0.00 | 0.00 | 0.00 | 0.00 | 0.00 | 0.00 | 0.00 | 0.00 | 0.00 | 0.00 | 0.00 | 0.00 | 0.00 | 0.00 | 0.00 | 0.00 | 0.00 |
| SG&A | 501.00M | 422.00M | 426.00M | 274.00M | 289.00M | 336.00M | 375.00M | 255.00M | 389.00M | 523.00M | 610.00M | 654.00M | 733.00M | 610.00M | 618.00M | 619.00M | 589.00M | 604.00M | 698.00M | 739.00M | 673.00M | 418.00M | 92.00M | -223.00M | -283.00M | -201.00M | -137.00M | -165.00M | -134.00M | -121.00M | -108.00M | -122.00M | 0.00 | 0.00 |
| Other Expenses | 0.00 | 756.00M | 763.00M | 643.00M | 601.00M | -69.00M | 493.00M | 505.00M | 546.00M | 615.00M | 684.00M | 645.00M | 670.00M | 643.00M | 612.00M | 447.00M | 487.00M | 428.00M | 352.00M | 357.00M | 307.00M | 307.00M | 250.00M | 595.00M | 519.00M | 495.00M | 543.00M | 523.00M | 528.00M | 532.00M | 523.00M | 496.00M | 253.00M | 278.00M |
| Operating Expenses | 2.25B | 1.18B | 1.19B | 917.00M | 890.00M | 854.00M | 870.00M | 760.00M | 935.00M | 1.14B | 1.29B | 1.30B | 1.40B | 1.25B | 1.23B | 1.07B | 1.08B | 1.03B | 1.05B | 1.10B | 980.00M | 725.00M | 686.00M | 372.00M | 236.00M | 294.00M | 406.00M | 358.00M | 394.00M | 411.00M | 415.00M | 374.00M | 253.00M | 278.00M |
| Cost & Expenses | 16.15B | 17.96B | 15.72B | 10.48B | 12.97B | 13.16B | 11.73B | 10.38B | 12.08B | 16.59B | 17.31B | 18.93B | 19.75B | 17.51B | 12.83B | 20.85B | 15.71B | 14.00B | 12.65B | 12.50B | 9.45B | 6.88B | 6.78B | 6.03B | 5.16B | 5.70B | 6.17B | 6.19B | 5.96B | 5.75B | 5.38B | 5.15B | 5.48B | 5.60B |
| Interest Income | 141.00M | 44.00M | 4.00M | 7.00M | 17.00M | 23.00M | 17.00M | 5.00M | 3.00M | 12.00M | 3.00M | 7.00M | 6.00M | 7.00M | 10.00M | 14.00M | 52.00M | 57.00M | 40.00M | 14.00M | 6.00M | 5.00M | 12.00M | 3.00M | 1.00M | 0.00 | 0.00 | 0.00 | 0.00 | 0.00 | 0.00 | 0.00 | 0.00 | 0.00 |
| Interest Expense | 72.00M | 159.00M | 313.00M | 232.00M | 142.00M | 168.00M | 226.00M | 230.00M | 214.00M | 234.00M | 266.00M | 214.00M | 190.00M | 274.00M | 149.00M | 169.00M | 125.00M | 106.00M | 79.00M | 120.00M | 146.00M | 128.00M | 127.00M | 96.00M | 54.00M | 0.00 | 0.00 | 0.00 | 0.00 | 0.00 | 0.00 | 0.00 | 0.00 | 0.00 |
| Depreciation & Amortization | 916.00M | 791.00M | 791.00M | 643.00M | 616.00M | 521.00M | 501.00M | 507.00M | 547.00M | 627.00M | 684.00M | 661.00M | 681.00M | 658.00M | 661.00M | 605.00M | 506.00M | 441.00M | 366.00M | 382.00M | 363.00M | 350.00M | 344.00M | 360.00M | 304.00M | 283.00M | 303.00M | 292.00M | 318.00M | 314.00M | 314.00M | 288.00M | 253.00M | 278.00M |
| EBITDA | 2.04B | 4.21B | 5.45B | -384.00M | 306.00M | 1.50B | 1.03B | 321.00M | -698.00M | 1.03B | -1.28B | 897.00M | 898.00M | 468.00M | -1.02B | 3.83B | 1.77B | 2.28B | 1.79B | 1.98B | -497.00M | 491.00M | -75.00M | 455.00M | 434.00M | 862.00M | 949.00M | 638.00M | 815.00M | 627.00M | 549.00M | 85.00M | -364.00M | 753.00M |
| EBITDA Ratio | 11.27% | 19.46% | 25.81% | -1.85% | 6.61% | 10.82% | 7.93% | 5.13% | 5.50% | 12.54% | 16.37% | 7.02% | 3.99% | 2.95% | -11.24% | 14.95% | 10.15% | 14.19% | 12.94% | 13.42% | 2.43% | 6.42% | -1.54% | 9.28% | 10.89% | 10.74% | 12.00% | 8.02% | 11.18% | 8.90% | 11.83% | 2.02% | -7.67% | 11.44% |
| Operating Income | 1.90B | 3.31B | 4.44B | -823.00M | 239.00M | 1.02B | 608.00M | -165.00M | -1.06B | 413.00M | -1.90B | 247.00M | 248.00M | -111.00M | -1.68B | 3.10B | 1.21B | 1.79B | 1.44B | 1.58B | -730.00M | 128.00M | -405.00M | 104.00M | 216.00M | 480.00M | 646.00M | 360.00M | 497.00M | 313.00M | 235.00M | -203.00M | -617.00M | 475.00M |
| Operating Income Ratio | 10.54% | 15.71% | 21.90% | -8.45% | 1.85% | 7.19% | 4.96% | -1.61% | -9.12% | 2.36% | -10.90% | 1.28% | 1.25% | -0.64% | -15.24% | 13.00% | 7.19% | 11.36% | 10.25% | 11.31% | -7.83% | 1.84% | -6.44% | 1.70% | 4.01% | 7.76% | 9.48% | 5.50% | 7.70% | 5.16% | 4.19% | -4.10% | -12.69% | 7.82% |
| Total Other Income/Expenses | -856.00M | -853.00M | -1.02B | -240.00M | -222.00M | -226.00M | -263.00M | -292.00M | -14.00M | -243.00M | -332.00M | -241.00M | -238.00M | -274.00M | -161.00M | -62.00M | -105.00M | 21.00M | -127.00M | -119.00M | -96.00M | -115.00M | -141.00M | -105.00M | -74.00M | 57.00M | 40.00M | 7.00M | -44.00M | -65.00M | -445.00M | -191.00M | -139.00M | -38.00M |
| Income Before Tax | 1.05B | 3.26B | 4.34B | -1.31B | -452.00M | 812.00M | 301.00M | -416.00M | -1.31B | 170.00M | -2.23B | 6.00M | 9.00M | -385.00M | -1.85B | 3.03B | 1.11B | 1.72B | 1.31B | 1.46B | -860.00M | 13.00M | -546.00M | -1.00M | 76.00M | 537.00M | 686.00M | 367.00M | 453.00M | 248.00M | -210.00M | -394.00M | -756.00M | 437.00M |
| Income Before Tax Ratio | 5.80% | 15.47% | 21.43% | -13.42% | -3.49% | 5.73% | 2.46% | -4.05% | -11.34% | 0.97% | -12.81% | 0.03% | 0.05% | -2.22% | -16.70% | 12.74% | 6.57% | 10.96% | 9.35% | 10.46% | -9.22% | 0.19% | -8.69% | -0.02% | 1.41% | 8.68% | 10.07% | 5.61% | 7.02% | 4.09% | -3.74% | -7.96% | -15.54% | 7.20% |
| Income Tax Expense | 152.00M | 735.00M | 170.00M | -142.00M | 190.00M | -303.00M | -86.00M | 24.00M | 196.00M | 68.00M | -168.00M | 131.00M | 77.00M | 97.00M | -439.00M | 862.00M | 218.00M | 324.00M | 365.00M | 351.00M | -454.00M | -48.00M | -328.00M | 20.00M | 25.00M | 173.00M | 234.00M | 92.00M | 150.00M | 47.00M | -41.00M | -123.00M | -249.00M | 127.00M |
| Net Income | 895.00M | 2.52B | 4.17B | -1.17B | -642.00M | 1.12B | 387.00M | -440.00M | -1.51B | 102.00M | -2.06B | -124.00M | -68.00M | -482.00M | -1.40B | 2.11B | 879.00M | 1.37B | 910.00M | 1.14B | -463.00M | 61.00M | -218.00M | -21.00M | 44.00M | 364.00M | 452.00M | 273.00M | 301.00M | 201.00M | -238.00M | -1.61B | -507.00M | 310.00M |
| Net Income Ratio | 4.96% | 11.98% | 20.59% | -11.96% | -4.96% | 7.86% | 3.16% | -4.29% | -13.03% | 0.58% | -11.85% | -0.64% | -0.34% | -2.77% | -12.68% | 8.87% | 5.21% | 8.74% | 6.48% | 8.13% | -4.96% | 0.88% | -3.47% | -0.34% | 0.82% | 5.89% | 6.63% | 4.17% | 4.66% | 3.31% | -4.24% | -32.46% | -10.42% | 5.10% |
| EPS | 4.04 | 10.22 | 15.77 | -5.92 | -3.75 | 6.31 | 2.21 | -2.81 | -10.32 | 0.71 | -14.28 | -0.86 | -0.47 | -3.36 | -10.42 | 18.04 | 7.44 | 11.88 | 7.87 | 10.00 | -4.49 | 0.62 | -2.44 | -0.24 | 0.40 | 4.05 | 5.24 | 2.98 | 3.51 | 2.35 | -3.71 | -28.80 | -9.96 | 6.00 |
| EPS Diluted | 3.56 | 9.16 | 14.88 | -5.92 | -3.75 | 6.25 | 2.19 | -2.81 | -10.32 | 0.69 | -14.28 | -0.86 | -0.47 | -3.36 | -10.42 | 17.96 | 7.40 | 11.18 | 7.00 | 8.83 | -4.49 | 0.62 | -2.44 | -0.24 | 0.40 | 3.92 | 4.88 | 2.95 | 3.41 | 2.33 | -3.71 | -28.80 | -9.96 | 6.00 |
| Weighted Avg Shares Out | 224.76M | 246.99M | 264.67M | 196.72M | 171.42M | 176.63M | 174.79M | 156.58M | 146.09M | 145.16M | 144.58M | 144.19M | 143.97M | 143.57M | 134.47M | 117.10M | 118.09M | 114.92M | 113.34M | 111.70M | 103.18M | 97.43M | 89.22M | 89.22M | 87.50M | 87.65M | 83.78M | 84.23M | 78.92M | 74.89M | 64.11M | 55.77M | 50.90M | 51.00M |
| Weighted Avg Shares Out (Dil) | 255.36M | 276.96M | 280.44M | 196.72M | 171.42M | 178.46M | 176.52M | 156.67M | 146.09M | 152.10M | 144.58M | 144.24M | 143.97M | 143.57M | 134.47M | 117.62M | 118.82M | 122.92M | 127.43M | 126.50M | 103.18M | 97.43M | 89.22M | 89.22M | 87.50M | 90.56M | 89.96M | 85.08M | 81.23M | 75.54M | 64.11M | 55.77M | 50.90M | 51.00M |

U. S. Steel Reacts to Important Department of Commerce Preliminary Results

Nippon Steel won't give up on its U.S. Steel takeover deal despite strong pushback

Nippon Steel committed to U.S. Steel takeover, aims to close in Dec, says executive

Trump vows to block Japan's Nippon Steel from buying U.S. Steel. Here's how

Trump Vows To Block US Steel Takeover by Nippon Steel

3-Stock Lunch: AT&T, Tesla & U.S. Steel

S&P 500: JOLTS Data Pressure; Tesla, US Steel Slide; South Korea ETF Drops on Tensions

Markets edge down as US jobs report looms; US Steel drops, Credo Technology surges

Trump doubles down on vow to block Nippon-US Steel deal, make US Steel ‘strong and great again'

ZS Slides, Trump Vows to Block X & Nippon Deal, T $40B Buyback
Source: https://incomestatements.info
Category: Stock Reports

What significant acquisitions has U.S. Steel made?
U.S. Steel finally acquired National Steel’s assets in 2003, after National Steel went bankrupt. As part of its diversification plan, U.S. Steel had acquired Marathon Oil on January 7, 1982, as well as Texas Oil and Gas several years later.
When was U.S. Steel founded and by whom?
US Steel was created in 1901 through a merger when a group led by J.P. Morgan and Charles Schwab, two of the world’s leading financiers of the time, bought the steel company owned by Andrew Carnegie and combined it with their holdings in its rival Federal Steel company.
What is U.S. Steel’s revenue trend over the past few years?
United States Steel annual revenue for 2023 was $18.053B, a 14.3% decline from 2022. United States Steel annual revenue for 2022 was $21.065B, a 3.9% increase from 2021. United States Steel annual revenue for 2021 was $20.275B, a 108.14% increase from 2020.