See more : Sino-i Technology Limited (0250.HK) Income Statement Analysis – Financial Results
Complete financial analysis of United States Steel Corporation (X) income statement, including revenue, profit margins, EPS and key performance metrics. Get detailed insights into the financial performance of United States Steel Corporation, a leading company in the Steel industry within the Basic Materials sector.
- Taiwan Taomee Co., Ltd. (6428.TWO) Income Statement Analysis – Financial Results
- Oxford Cannabinoid Technologies Holdings Plc (OCTP.L) Income Statement Analysis – Financial Results
- Arise AB (publ) (ARISE.ST) Income Statement Analysis – Financial Results
- PT Perma Plasindo Tbk (BINO.JK) Income Statement Analysis – Financial Results
- Nubeva Technologies Ltd. (NBVA.V) Income Statement Analysis – Financial Results
United States Steel Corporation (X)
About United States Steel Corporation
United States Steel Corporation produces and sells flat-rolled and tubular steel products primarily in North America and Europe. It operates through four segments: North American Flat-Rolled (Flat-Rolled), Mini Mill, U. S. Steel Europe (USSE), and Tubular Products (Tubular). The Flat-Rolled segment offers slabs, strip mill plates, sheets, and tin mill products, as well as iron ore and coke. This segment serves customers in the service center, conversion, transportation, automotive, construction, container, appliance, and electrical markets. The Mini Mill segment provides hot-rolled, cold-rolled, and coated sheets and electrical products. This segment serves customers in the automotive, appliance, construction, container, transportation, and service center markets. The USSE segment provides slabs, strip mill plates, sheets, tin mill products, and spiral welded pipes. This segment serves customers in the construction, container, appliance and electrical, service center, conversion, oil, gas, and petrochemical markets. The Tubular segment offers seamless and electric resistance welded steel casing and tubing products, as well as standard and line pipe and mechanical tubing products primarily to customers in the oil, gas, and petrochemical markets. The company also engages in the real estate business. United States Steel Corporation was founded in 1901 and is headquartered in Pittsburgh, Pennsylvania.
| Metric | 2023 | 2022 | 2021 | 2020 | 2019 | 2018 | 2017 | 2016 | 2015 | 2014 | 2013 | 2012 | 2011 | 2010 | 2009 | 2008 | 2007 | 2006 | 2005 | 2004 | 2003 | 2002 | 2001 | 2000 | 1999 | 1998 | 1997 | 1996 | 1995 | 1994 | 1993 | 1992 | 1991 | 1990 |
|---|---|---|---|---|---|---|---|---|---|---|---|---|---|---|---|---|---|---|---|---|---|---|---|---|---|---|---|---|---|---|---|---|---|---|
| Revenue | 18.05B | 21.07B | 20.28B | 9.74B | 12.94B | 14.18B | 12.25B | 10.26B | 11.57B | 17.51B | 17.42B | 19.33B | 19.88B | 17.37B | 11.05B | 23.82B | 16.87B | 15.72B | 14.04B | 13.97B | 9.33B | 6.95B | 6.29B | 6.13B | 5.38B | 6.18B | 6.81B | 6.55B | 6.46B | 6.07B | 5.61B | 4.95B | 4.86B | 6.07B |
| Cost of Revenue | 15.80B | 16.78B | 14.53B | 9.56B | 12.08B | 12.31B | 10.86B | 9.62B | 11.14B | 15.45B | 16.02B | 17.63B | 18.34B | 16.26B | 11.60B | 19.78B | 14.63B | 12.97B | 11.60B | 11.41B | 8.47B | 6.16B | 6.09B | 5.66B | 4.93B | 5.41B | 5.76B | 5.83B | 5.57B | 5.34B | 4.96B | 4.78B | 5.23B | 5.32B |
| Gross Profit | 2.25B | 4.29B | 5.74B | 183.00M | 855.00M | 1.87B | 1.39B | 638.00M | 433.00M | 2.06B | 1.41B | 1.70B | 1.54B | 1.12B | -549.00M | 4.04B | 2.24B | 2.75B | 2.44B | 2.56B | 859.00M | 791.00M | 195.00M | 476.00M | 452.00M | 774.00M | 1.05B | 718.00M | 891.00M | 724.00M | 650.00M | 171.00M | -364.00M | 753.00M |
| Gross Profit Ratio | 12.46% | 20.36% | 28.32% | 1.88% | 6.61% | 13.21% | 11.31% | 6.22% | 3.74% | 11.76% | 8.08% | 8.79% | 7.75% | 6.42% | -4.97% | 16.95% | 13.28% | 17.48% | 17.37% | 18.34% | 9.21% | 11.38% | 3.10% | 7.76% | 8.40% | 12.52% | 15.44% | 10.97% | 13.80% | 11.94% | 11.58% | 3.46% | -7.48% | 12.40% |
| Research & Development | 0.00 | 0.00 | 0.00 | 0.00 | 0.00 | 0.00 | 0.00 | 0.00 | 0.00 | 0.00 | 0.00 | 0.00 | 0.00 | 0.00 | 0.00 | 0.00 | 0.00 | 0.00 | 0.00 | 0.00 | 0.00 | 0.00 | 0.00 | 0.00 | 0.00 | 0.00 | 0.00 | 0.00 | 0.00 | 0.00 | 0.00 | 0.00 | 0.00 | 0.00 |
| General & Administrative | 0.00 | 0.00 | 0.00 | 0.00 | 0.00 | 336.00M | 375.00M | 255.00M | 415.00M | 523.00M | 610.00M | 654.00M | 733.00M | 610.00M | 618.00M | 625.00M | 589.00M | 604.00M | 698.00M | 739.00M | 673.00M | 418.00M | 0.00 | 0.00 | 0.00 | 0.00 | 0.00 | 0.00 | 0.00 | 0.00 | 0.00 | 0.00 | 0.00 | 0.00 |
| Selling & Marketing | 0.00 | 0.00 | 0.00 | 0.00 | 0.00 | 0.00 | 0.00 | 0.00 | -26.00M | 0.00 | 0.00 | 0.00 | 0.00 | 0.00 | 0.00 | -6.00M | 0.00 | 0.00 | 0.00 | 0.00 | 0.00 | 0.00 | 0.00 | 0.00 | 0.00 | 0.00 | 0.00 | 0.00 | 0.00 | 0.00 | 0.00 | 0.00 | 0.00 | 0.00 |
| SG&A | 501.00M | 422.00M | 426.00M | 274.00M | 289.00M | 336.00M | 375.00M | 255.00M | 389.00M | 523.00M | 610.00M | 654.00M | 733.00M | 610.00M | 618.00M | 619.00M | 589.00M | 604.00M | 698.00M | 739.00M | 673.00M | 418.00M | 92.00M | -223.00M | -283.00M | -201.00M | -137.00M | -165.00M | -134.00M | -121.00M | -108.00M | -122.00M | 0.00 | 0.00 |
| Other Expenses | 0.00 | 756.00M | 763.00M | 643.00M | 601.00M | -69.00M | 493.00M | 505.00M | 546.00M | 615.00M | 684.00M | 645.00M | 670.00M | 643.00M | 612.00M | 447.00M | 487.00M | 428.00M | 352.00M | 357.00M | 307.00M | 307.00M | 250.00M | 595.00M | 519.00M | 495.00M | 543.00M | 523.00M | 528.00M | 532.00M | 523.00M | 496.00M | 253.00M | 278.00M |
| Operating Expenses | 2.25B | 1.18B | 1.19B | 917.00M | 890.00M | 854.00M | 870.00M | 760.00M | 935.00M | 1.14B | 1.29B | 1.30B | 1.40B | 1.25B | 1.23B | 1.07B | 1.08B | 1.03B | 1.05B | 1.10B | 980.00M | 725.00M | 686.00M | 372.00M | 236.00M | 294.00M | 406.00M | 358.00M | 394.00M | 411.00M | 415.00M | 374.00M | 253.00M | 278.00M |
| Cost & Expenses | 16.15B | 17.96B | 15.72B | 10.48B | 12.97B | 13.16B | 11.73B | 10.38B | 12.08B | 16.59B | 17.31B | 18.93B | 19.75B | 17.51B | 12.83B | 20.85B | 15.71B | 14.00B | 12.65B | 12.50B | 9.45B | 6.88B | 6.78B | 6.03B | 5.16B | 5.70B | 6.17B | 6.19B | 5.96B | 5.75B | 5.38B | 5.15B | 5.48B | 5.60B |
| Interest Income | 141.00M | 44.00M | 4.00M | 7.00M | 17.00M | 23.00M | 17.00M | 5.00M | 3.00M | 12.00M | 3.00M | 7.00M | 6.00M | 7.00M | 10.00M | 14.00M | 52.00M | 57.00M | 40.00M | 14.00M | 6.00M | 5.00M | 12.00M | 3.00M | 1.00M | 0.00 | 0.00 | 0.00 | 0.00 | 0.00 | 0.00 | 0.00 | 0.00 | 0.00 |
| Interest Expense | 72.00M | 159.00M | 313.00M | 232.00M | 142.00M | 168.00M | 226.00M | 230.00M | 214.00M | 234.00M | 266.00M | 214.00M | 190.00M | 274.00M | 149.00M | 169.00M | 125.00M | 106.00M | 79.00M | 120.00M | 146.00M | 128.00M | 127.00M | 96.00M | 54.00M | 0.00 | 0.00 | 0.00 | 0.00 | 0.00 | 0.00 | 0.00 | 0.00 | 0.00 |
| Depreciation & Amortization | 916.00M | 791.00M | 791.00M | 643.00M | 616.00M | 521.00M | 501.00M | 507.00M | 547.00M | 627.00M | 684.00M | 661.00M | 681.00M | 658.00M | 661.00M | 605.00M | 506.00M | 441.00M | 366.00M | 382.00M | 363.00M | 350.00M | 344.00M | 360.00M | 304.00M | 283.00M | 303.00M | 292.00M | 318.00M | 314.00M | 314.00M | 288.00M | 253.00M | 278.00M |
| EBITDA | 2.04B | 4.21B | 5.45B | -384.00M | 306.00M | 1.50B | 1.03B | 321.00M | -698.00M | 1.03B | -1.28B | 897.00M | 898.00M | 468.00M | -1.02B | 3.83B | 1.77B | 2.28B | 1.79B | 1.98B | -497.00M | 491.00M | -75.00M | 455.00M | 434.00M | 862.00M | 949.00M | 638.00M | 815.00M | 627.00M | 549.00M | 85.00M | -364.00M | 753.00M |
| EBITDA Ratio | 11.27% | 19.46% | 25.81% | -1.85% | 6.61% | 10.82% | 7.93% | 5.13% | 5.50% | 12.54% | 16.37% | 7.02% | 3.99% | 2.95% | -11.24% | 14.95% | 10.15% | 14.19% | 12.94% | 13.42% | 2.43% | 6.42% | -1.54% | 9.28% | 10.89% | 10.74% | 12.00% | 8.02% | 11.18% | 8.90% | 11.83% | 2.02% | -7.67% | 11.44% |
| Operating Income | 1.90B | 3.31B | 4.44B | -823.00M | 239.00M | 1.02B | 608.00M | -165.00M | -1.06B | 413.00M | -1.90B | 247.00M | 248.00M | -111.00M | -1.68B | 3.10B | 1.21B | 1.79B | 1.44B | 1.58B | -730.00M | 128.00M | -405.00M | 104.00M | 216.00M | 480.00M | 646.00M | 360.00M | 497.00M | 313.00M | 235.00M | -203.00M | -617.00M | 475.00M |
| Operating Income Ratio | 10.54% | 15.71% | 21.90% | -8.45% | 1.85% | 7.19% | 4.96% | -1.61% | -9.12% | 2.36% | -10.90% | 1.28% | 1.25% | -0.64% | -15.24% | 13.00% | 7.19% | 11.36% | 10.25% | 11.31% | -7.83% | 1.84% | -6.44% | 1.70% | 4.01% | 7.76% | 9.48% | 5.50% | 7.70% | 5.16% | 4.19% | -4.10% | -12.69% | 7.82% |
| Total Other Income/Expenses | -856.00M | -853.00M | -1.02B | -240.00M | -222.00M | -226.00M | -263.00M | -292.00M | -14.00M | -243.00M | -332.00M | -241.00M | -238.00M | -274.00M | -161.00M | -62.00M | -105.00M | 21.00M | -127.00M | -119.00M | -96.00M | -115.00M | -141.00M | -105.00M | -74.00M | 57.00M | 40.00M | 7.00M | -44.00M | -65.00M | -445.00M | -191.00M | -139.00M | -38.00M |
| Income Before Tax | 1.05B | 3.26B | 4.34B | -1.31B | -452.00M | 812.00M | 301.00M | -416.00M | -1.31B | 170.00M | -2.23B | 6.00M | 9.00M | -385.00M | -1.85B | 3.03B | 1.11B | 1.72B | 1.31B | 1.46B | -860.00M | 13.00M | -546.00M | -1.00M | 76.00M | 537.00M | 686.00M | 367.00M | 453.00M | 248.00M | -210.00M | -394.00M | -756.00M | 437.00M |
| Income Before Tax Ratio | 5.80% | 15.47% | 21.43% | -13.42% | -3.49% | 5.73% | 2.46% | -4.05% | -11.34% | 0.97% | -12.81% | 0.03% | 0.05% | -2.22% | -16.70% | 12.74% | 6.57% | 10.96% | 9.35% | 10.46% | -9.22% | 0.19% | -8.69% | -0.02% | 1.41% | 8.68% | 10.07% | 5.61% | 7.02% | 4.09% | -3.74% | -7.96% | -15.54% | 7.20% |
| Income Tax Expense | 152.00M | 735.00M | 170.00M | -142.00M | 190.00M | -303.00M | -86.00M | 24.00M | 196.00M | 68.00M | -168.00M | 131.00M | 77.00M | 97.00M | -439.00M | 862.00M | 218.00M | 324.00M | 365.00M | 351.00M | -454.00M | -48.00M | -328.00M | 20.00M | 25.00M | 173.00M | 234.00M | 92.00M | 150.00M | 47.00M | -41.00M | -123.00M | -249.00M | 127.00M |
| Net Income | 895.00M | 2.52B | 4.17B | -1.17B | -642.00M | 1.12B | 387.00M | -440.00M | -1.51B | 102.00M | -2.06B | -124.00M | -68.00M | -482.00M | -1.40B | 2.11B | 879.00M | 1.37B | 910.00M | 1.14B | -463.00M | 61.00M | -218.00M | -21.00M | 44.00M | 364.00M | 452.00M | 273.00M | 301.00M | 201.00M | -238.00M | -1.61B | -507.00M | 310.00M |
| Net Income Ratio | 4.96% | 11.98% | 20.59% | -11.96% | -4.96% | 7.86% | 3.16% | -4.29% | -13.03% | 0.58% | -11.85% | -0.64% | -0.34% | -2.77% | -12.68% | 8.87% | 5.21% | 8.74% | 6.48% | 8.13% | -4.96% | 0.88% | -3.47% | -0.34% | 0.82% | 5.89% | 6.63% | 4.17% | 4.66% | 3.31% | -4.24% | -32.46% | -10.42% | 5.10% |
| EPS | 4.04 | 10.22 | 15.77 | -5.92 | -3.75 | 6.31 | 2.21 | -2.81 | -10.32 | 0.71 | -14.28 | -0.86 | -0.47 | -3.36 | -10.42 | 18.04 | 7.44 | 11.88 | 7.87 | 10.00 | -4.49 | 0.62 | -2.44 | -0.24 | 0.40 | 4.05 | 5.24 | 2.98 | 3.51 | 2.35 | -3.71 | -28.80 | -9.96 | 6.00 |
| EPS Diluted | 3.56 | 9.16 | 14.88 | -5.92 | -3.75 | 6.25 | 2.19 | -2.81 | -10.32 | 0.69 | -14.28 | -0.86 | -0.47 | -3.36 | -10.42 | 17.96 | 7.40 | 11.18 | 7.00 | 8.83 | -4.49 | 0.62 | -2.44 | -0.24 | 0.40 | 3.92 | 4.88 | 2.95 | 3.41 | 2.33 | -3.71 | -28.80 | -9.96 | 6.00 |
| Weighted Avg Shares Out | 224.76M | 246.99M | 264.67M | 196.72M | 171.42M | 176.63M | 174.79M | 156.58M | 146.09M | 145.16M | 144.58M | 144.19M | 143.97M | 143.57M | 134.47M | 117.10M | 118.09M | 114.92M | 113.34M | 111.70M | 103.18M | 97.43M | 89.22M | 89.22M | 87.50M | 87.65M | 83.78M | 84.23M | 78.92M | 74.89M | 64.11M | 55.77M | 50.90M | 51.00M |
| Weighted Avg Shares Out (Dil) | 255.36M | 276.96M | 280.44M | 196.72M | 171.42M | 178.46M | 176.52M | 156.67M | 146.09M | 152.10M | 144.58M | 144.24M | 143.97M | 143.57M | 134.47M | 117.62M | 118.82M | 122.92M | 127.43M | 126.50M | 103.18M | 97.43M | 89.22M | 89.22M | 87.50M | 90.56M | 89.96M | 85.08M | 81.23M | 75.54M | 64.11M | 55.77M | 50.90M | 51.00M |

3 Stocks Poised to Ride America's Manufacturing and Ag Revival
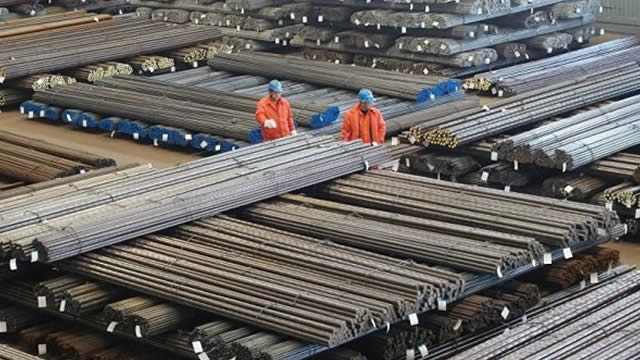
Mining sector faces 'small negative' from Trump in White House, positive for US steel
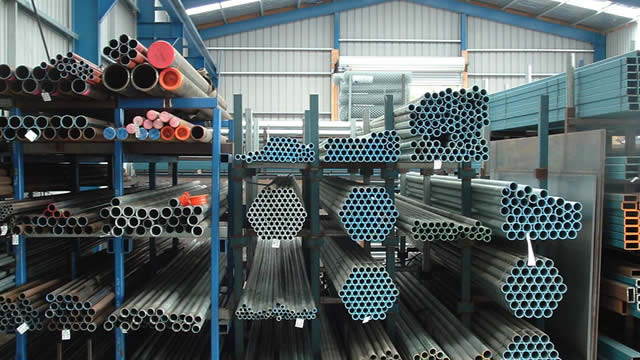
Why U.S. Steel Stocks Were Soaring Today

Shares of Companies with Big Merger Plans Jump After Trump Election
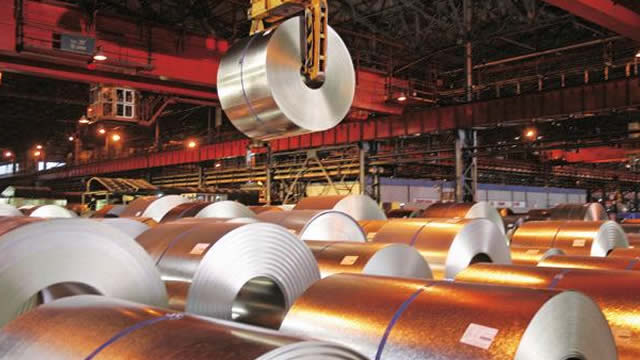
U.S. Steel's Earnings and Revenues Surpass Estimates in Q3

U.S. Steel (X) Q3 Earnings: Taking a Look at Key Metrics Versus Estimates
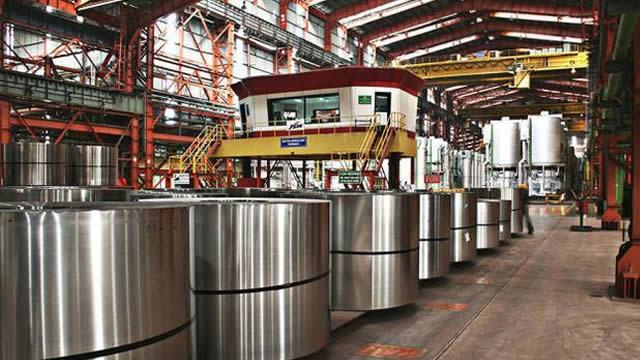
United States Steel (X) Beats Q3 Earnings and Revenue Estimates

United States Steel Corporation Declares Dividend

Xsolla and AurumDust Launch Charity Campaign With Ash of Gods: The Way to Support Games For Change
U.S. Steel (X) Q3 Earnings on the Horizon: Analysts' Insights on Key Performance Measures
Source: https://incomestatements.info
Category: Stock Reports
