See more : ENB Financial Corp (ENBP) Income Statement Analysis – Financial Results
Complete financial analysis of United States Steel Corporation (X) income statement, including revenue, profit margins, EPS and key performance metrics. Get detailed insights into the financial performance of United States Steel Corporation, a leading company in the Steel industry within the Basic Materials sector.
- Hansa Investment Company Limited (HAN.L) Income Statement Analysis – Financial Results
- Shervani Industrial Syndicate Limited (SHERVANI.BO) Income Statement Analysis – Financial Results
- 3P Land Holdings Limited (3PLAND.NS) Income Statement Analysis – Financial Results
- Ryanair Holdings plc (RYA.IR) Income Statement Analysis – Financial Results
- Nitchitsu Co., Ltd. (7021.T) Income Statement Analysis – Financial Results
United States Steel Corporation (X)
About United States Steel Corporation
United States Steel Corporation produces and sells flat-rolled and tubular steel products primarily in North America and Europe. It operates through four segments: North American Flat-Rolled (Flat-Rolled), Mini Mill, U. S. Steel Europe (USSE), and Tubular Products (Tubular). The Flat-Rolled segment offers slabs, strip mill plates, sheets, and tin mill products, as well as iron ore and coke. This segment serves customers in the service center, conversion, transportation, automotive, construction, container, appliance, and electrical markets. The Mini Mill segment provides hot-rolled, cold-rolled, and coated sheets and electrical products. This segment serves customers in the automotive, appliance, construction, container, transportation, and service center markets. The USSE segment provides slabs, strip mill plates, sheets, tin mill products, and spiral welded pipes. This segment serves customers in the construction, container, appliance and electrical, service center, conversion, oil, gas, and petrochemical markets. The Tubular segment offers seamless and electric resistance welded steel casing and tubing products, as well as standard and line pipe and mechanical tubing products primarily to customers in the oil, gas, and petrochemical markets. The company also engages in the real estate business. United States Steel Corporation was founded in 1901 and is headquartered in Pittsburgh, Pennsylvania.
| Metric | 2023 | 2022 | 2021 | 2020 | 2019 | 2018 | 2017 | 2016 | 2015 | 2014 | 2013 | 2012 | 2011 | 2010 | 2009 | 2008 | 2007 | 2006 | 2005 | 2004 | 2003 | 2002 | 2001 | 2000 | 1999 | 1998 | 1997 | 1996 | 1995 | 1994 | 1993 | 1992 | 1991 | 1990 |
|---|---|---|---|---|---|---|---|---|---|---|---|---|---|---|---|---|---|---|---|---|---|---|---|---|---|---|---|---|---|---|---|---|---|---|
| Revenue | 18.05B | 21.07B | 20.28B | 9.74B | 12.94B | 14.18B | 12.25B | 10.26B | 11.57B | 17.51B | 17.42B | 19.33B | 19.88B | 17.37B | 11.05B | 23.82B | 16.87B | 15.72B | 14.04B | 13.97B | 9.33B | 6.95B | 6.29B | 6.13B | 5.38B | 6.18B | 6.81B | 6.55B | 6.46B | 6.07B | 5.61B | 4.95B | 4.86B | 6.07B |
| Cost of Revenue | 15.80B | 16.78B | 14.53B | 9.56B | 12.08B | 12.31B | 10.86B | 9.62B | 11.14B | 15.45B | 16.02B | 17.63B | 18.34B | 16.26B | 11.60B | 19.78B | 14.63B | 12.97B | 11.60B | 11.41B | 8.47B | 6.16B | 6.09B | 5.66B | 4.93B | 5.41B | 5.76B | 5.83B | 5.57B | 5.34B | 4.96B | 4.78B | 5.23B | 5.32B |
| Gross Profit | 2.25B | 4.29B | 5.74B | 183.00M | 855.00M | 1.87B | 1.39B | 638.00M | 433.00M | 2.06B | 1.41B | 1.70B | 1.54B | 1.12B | -549.00M | 4.04B | 2.24B | 2.75B | 2.44B | 2.56B | 859.00M | 791.00M | 195.00M | 476.00M | 452.00M | 774.00M | 1.05B | 718.00M | 891.00M | 724.00M | 650.00M | 171.00M | -364.00M | 753.00M |
| Gross Profit Ratio | 12.46% | 20.36% | 28.32% | 1.88% | 6.61% | 13.21% | 11.31% | 6.22% | 3.74% | 11.76% | 8.08% | 8.79% | 7.75% | 6.42% | -4.97% | 16.95% | 13.28% | 17.48% | 17.37% | 18.34% | 9.21% | 11.38% | 3.10% | 7.76% | 8.40% | 12.52% | 15.44% | 10.97% | 13.80% | 11.94% | 11.58% | 3.46% | -7.48% | 12.40% |
| Research & Development | 0.00 | 0.00 | 0.00 | 0.00 | 0.00 | 0.00 | 0.00 | 0.00 | 0.00 | 0.00 | 0.00 | 0.00 | 0.00 | 0.00 | 0.00 | 0.00 | 0.00 | 0.00 | 0.00 | 0.00 | 0.00 | 0.00 | 0.00 | 0.00 | 0.00 | 0.00 | 0.00 | 0.00 | 0.00 | 0.00 | 0.00 | 0.00 | 0.00 | 0.00 |
| General & Administrative | 0.00 | 0.00 | 0.00 | 0.00 | 0.00 | 336.00M | 375.00M | 255.00M | 415.00M | 523.00M | 610.00M | 654.00M | 733.00M | 610.00M | 618.00M | 625.00M | 589.00M | 604.00M | 698.00M | 739.00M | 673.00M | 418.00M | 0.00 | 0.00 | 0.00 | 0.00 | 0.00 | 0.00 | 0.00 | 0.00 | 0.00 | 0.00 | 0.00 | 0.00 |
| Selling & Marketing | 0.00 | 0.00 | 0.00 | 0.00 | 0.00 | 0.00 | 0.00 | 0.00 | -26.00M | 0.00 | 0.00 | 0.00 | 0.00 | 0.00 | 0.00 | -6.00M | 0.00 | 0.00 | 0.00 | 0.00 | 0.00 | 0.00 | 0.00 | 0.00 | 0.00 | 0.00 | 0.00 | 0.00 | 0.00 | 0.00 | 0.00 | 0.00 | 0.00 | 0.00 |
| SG&A | 501.00M | 422.00M | 426.00M | 274.00M | 289.00M | 336.00M | 375.00M | 255.00M | 389.00M | 523.00M | 610.00M | 654.00M | 733.00M | 610.00M | 618.00M | 619.00M | 589.00M | 604.00M | 698.00M | 739.00M | 673.00M | 418.00M | 92.00M | -223.00M | -283.00M | -201.00M | -137.00M | -165.00M | -134.00M | -121.00M | -108.00M | -122.00M | 0.00 | 0.00 |
| Other Expenses | 0.00 | 756.00M | 763.00M | 643.00M | 601.00M | -69.00M | 493.00M | 505.00M | 546.00M | 615.00M | 684.00M | 645.00M | 670.00M | 643.00M | 612.00M | 447.00M | 487.00M | 428.00M | 352.00M | 357.00M | 307.00M | 307.00M | 250.00M | 595.00M | 519.00M | 495.00M | 543.00M | 523.00M | 528.00M | 532.00M | 523.00M | 496.00M | 253.00M | 278.00M |
| Operating Expenses | 2.25B | 1.18B | 1.19B | 917.00M | 890.00M | 854.00M | 870.00M | 760.00M | 935.00M | 1.14B | 1.29B | 1.30B | 1.40B | 1.25B | 1.23B | 1.07B | 1.08B | 1.03B | 1.05B | 1.10B | 980.00M | 725.00M | 686.00M | 372.00M | 236.00M | 294.00M | 406.00M | 358.00M | 394.00M | 411.00M | 415.00M | 374.00M | 253.00M | 278.00M |
| Cost & Expenses | 16.15B | 17.96B | 15.72B | 10.48B | 12.97B | 13.16B | 11.73B | 10.38B | 12.08B | 16.59B | 17.31B | 18.93B | 19.75B | 17.51B | 12.83B | 20.85B | 15.71B | 14.00B | 12.65B | 12.50B | 9.45B | 6.88B | 6.78B | 6.03B | 5.16B | 5.70B | 6.17B | 6.19B | 5.96B | 5.75B | 5.38B | 5.15B | 5.48B | 5.60B |
| Interest Income | 141.00M | 44.00M | 4.00M | 7.00M | 17.00M | 23.00M | 17.00M | 5.00M | 3.00M | 12.00M | 3.00M | 7.00M | 6.00M | 7.00M | 10.00M | 14.00M | 52.00M | 57.00M | 40.00M | 14.00M | 6.00M | 5.00M | 12.00M | 3.00M | 1.00M | 0.00 | 0.00 | 0.00 | 0.00 | 0.00 | 0.00 | 0.00 | 0.00 | 0.00 |
| Interest Expense | 72.00M | 159.00M | 313.00M | 232.00M | 142.00M | 168.00M | 226.00M | 230.00M | 214.00M | 234.00M | 266.00M | 214.00M | 190.00M | 274.00M | 149.00M | 169.00M | 125.00M | 106.00M | 79.00M | 120.00M | 146.00M | 128.00M | 127.00M | 96.00M | 54.00M | 0.00 | 0.00 | 0.00 | 0.00 | 0.00 | 0.00 | 0.00 | 0.00 | 0.00 |
| Depreciation & Amortization | 916.00M | 791.00M | 791.00M | 643.00M | 616.00M | 521.00M | 501.00M | 507.00M | 547.00M | 627.00M | 684.00M | 661.00M | 681.00M | 658.00M | 661.00M | 605.00M | 506.00M | 441.00M | 366.00M | 382.00M | 363.00M | 350.00M | 344.00M | 360.00M | 304.00M | 283.00M | 303.00M | 292.00M | 318.00M | 314.00M | 314.00M | 288.00M | 253.00M | 278.00M |
| EBITDA | 2.04B | 4.21B | 5.45B | -384.00M | 306.00M | 1.50B | 1.03B | 321.00M | -698.00M | 1.03B | -1.28B | 897.00M | 898.00M | 468.00M | -1.02B | 3.83B | 1.77B | 2.28B | 1.79B | 1.98B | -497.00M | 491.00M | -75.00M | 455.00M | 434.00M | 862.00M | 949.00M | 638.00M | 815.00M | 627.00M | 549.00M | 85.00M | -364.00M | 753.00M |
| EBITDA Ratio | 11.27% | 19.46% | 25.81% | -1.85% | 6.61% | 10.82% | 7.93% | 5.13% | 5.50% | 12.54% | 16.37% | 7.02% | 3.99% | 2.95% | -11.24% | 14.95% | 10.15% | 14.19% | 12.94% | 13.42% | 2.43% | 6.42% | -1.54% | 9.28% | 10.89% | 10.74% | 12.00% | 8.02% | 11.18% | 8.90% | 11.83% | 2.02% | -7.67% | 11.44% |
| Operating Income | 1.90B | 3.31B | 4.44B | -823.00M | 239.00M | 1.02B | 608.00M | -165.00M | -1.06B | 413.00M | -1.90B | 247.00M | 248.00M | -111.00M | -1.68B | 3.10B | 1.21B | 1.79B | 1.44B | 1.58B | -730.00M | 128.00M | -405.00M | 104.00M | 216.00M | 480.00M | 646.00M | 360.00M | 497.00M | 313.00M | 235.00M | -203.00M | -617.00M | 475.00M |
| Operating Income Ratio | 10.54% | 15.71% | 21.90% | -8.45% | 1.85% | 7.19% | 4.96% | -1.61% | -9.12% | 2.36% | -10.90% | 1.28% | 1.25% | -0.64% | -15.24% | 13.00% | 7.19% | 11.36% | 10.25% | 11.31% | -7.83% | 1.84% | -6.44% | 1.70% | 4.01% | 7.76% | 9.48% | 5.50% | 7.70% | 5.16% | 4.19% | -4.10% | -12.69% | 7.82% |
| Total Other Income/Expenses | -856.00M | -853.00M | -1.02B | -240.00M | -222.00M | -226.00M | -263.00M | -292.00M | -14.00M | -243.00M | -332.00M | -241.00M | -238.00M | -274.00M | -161.00M | -62.00M | -105.00M | 21.00M | -127.00M | -119.00M | -96.00M | -115.00M | -141.00M | -105.00M | -74.00M | 57.00M | 40.00M | 7.00M | -44.00M | -65.00M | -445.00M | -191.00M | -139.00M | -38.00M |
| Income Before Tax | 1.05B | 3.26B | 4.34B | -1.31B | -452.00M | 812.00M | 301.00M | -416.00M | -1.31B | 170.00M | -2.23B | 6.00M | 9.00M | -385.00M | -1.85B | 3.03B | 1.11B | 1.72B | 1.31B | 1.46B | -860.00M | 13.00M | -546.00M | -1.00M | 76.00M | 537.00M | 686.00M | 367.00M | 453.00M | 248.00M | -210.00M | -394.00M | -756.00M | 437.00M |
| Income Before Tax Ratio | 5.80% | 15.47% | 21.43% | -13.42% | -3.49% | 5.73% | 2.46% | -4.05% | -11.34% | 0.97% | -12.81% | 0.03% | 0.05% | -2.22% | -16.70% | 12.74% | 6.57% | 10.96% | 9.35% | 10.46% | -9.22% | 0.19% | -8.69% | -0.02% | 1.41% | 8.68% | 10.07% | 5.61% | 7.02% | 4.09% | -3.74% | -7.96% | -15.54% | 7.20% |
| Income Tax Expense | 152.00M | 735.00M | 170.00M | -142.00M | 190.00M | -303.00M | -86.00M | 24.00M | 196.00M | 68.00M | -168.00M | 131.00M | 77.00M | 97.00M | -439.00M | 862.00M | 218.00M | 324.00M | 365.00M | 351.00M | -454.00M | -48.00M | -328.00M | 20.00M | 25.00M | 173.00M | 234.00M | 92.00M | 150.00M | 47.00M | -41.00M | -123.00M | -249.00M | 127.00M |
| Net Income | 895.00M | 2.52B | 4.17B | -1.17B | -642.00M | 1.12B | 387.00M | -440.00M | -1.51B | 102.00M | -2.06B | -124.00M | -68.00M | -482.00M | -1.40B | 2.11B | 879.00M | 1.37B | 910.00M | 1.14B | -463.00M | 61.00M | -218.00M | -21.00M | 44.00M | 364.00M | 452.00M | 273.00M | 301.00M | 201.00M | -238.00M | -1.61B | -507.00M | 310.00M |
| Net Income Ratio | 4.96% | 11.98% | 20.59% | -11.96% | -4.96% | 7.86% | 3.16% | -4.29% | -13.03% | 0.58% | -11.85% | -0.64% | -0.34% | -2.77% | -12.68% | 8.87% | 5.21% | 8.74% | 6.48% | 8.13% | -4.96% | 0.88% | -3.47% | -0.34% | 0.82% | 5.89% | 6.63% | 4.17% | 4.66% | 3.31% | -4.24% | -32.46% | -10.42% | 5.10% |
| EPS | 4.04 | 10.22 | 15.77 | -5.92 | -3.75 | 6.31 | 2.21 | -2.81 | -10.32 | 0.71 | -14.28 | -0.86 | -0.47 | -3.36 | -10.42 | 18.04 | 7.44 | 11.88 | 7.87 | 10.00 | -4.49 | 0.62 | -2.44 | -0.24 | 0.40 | 4.05 | 5.24 | 2.98 | 3.51 | 2.35 | -3.71 | -28.80 | -9.96 | 6.00 |
| EPS Diluted | 3.56 | 9.16 | 14.88 | -5.92 | -3.75 | 6.25 | 2.19 | -2.81 | -10.32 | 0.69 | -14.28 | -0.86 | -0.47 | -3.36 | -10.42 | 17.96 | 7.40 | 11.18 | 7.00 | 8.83 | -4.49 | 0.62 | -2.44 | -0.24 | 0.40 | 3.92 | 4.88 | 2.95 | 3.41 | 2.33 | -3.71 | -28.80 | -9.96 | 6.00 |
| Weighted Avg Shares Out | 224.76M | 246.99M | 264.67M | 196.72M | 171.42M | 176.63M | 174.79M | 156.58M | 146.09M | 145.16M | 144.58M | 144.19M | 143.97M | 143.57M | 134.47M | 117.10M | 118.09M | 114.92M | 113.34M | 111.70M | 103.18M | 97.43M | 89.22M | 89.22M | 87.50M | 87.65M | 83.78M | 84.23M | 78.92M | 74.89M | 64.11M | 55.77M | 50.90M | 51.00M |
| Weighted Avg Shares Out (Dil) | 255.36M | 276.96M | 280.44M | 196.72M | 171.42M | 178.46M | 176.52M | 156.67M | 146.09M | 152.10M | 144.58M | 144.24M | 143.97M | 143.57M | 134.47M | 117.62M | 118.82M | 122.92M | 127.43M | 126.50M | 103.18M | 97.43M | 89.22M | 89.22M | 87.50M | 90.56M | 89.96M | 85.08M | 81.23M | 75.54M | 64.11M | 55.77M | 50.90M | 51.00M |
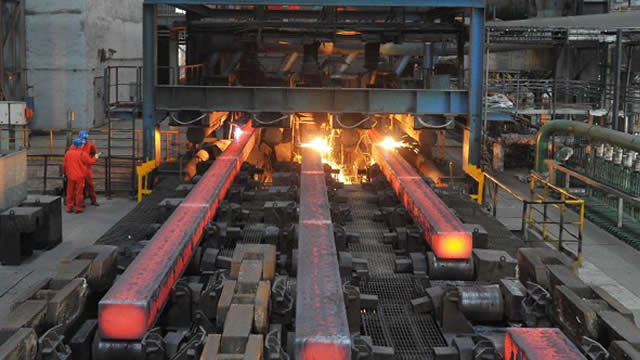
This United States Steel Analyst Turns Bullish; Here Are Top 5 Upgrades For Monday
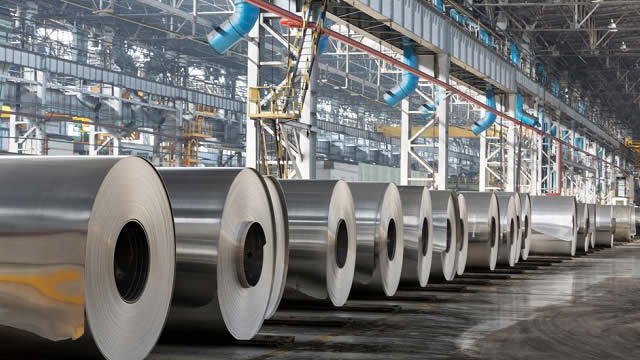
The fight over US Steel is intensifying, and a top competitor now wants in
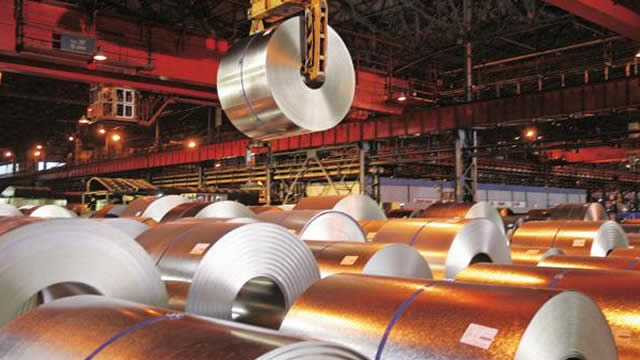
U.S. Steel Stock Still Has Value. Wall Street Is Weighing In.
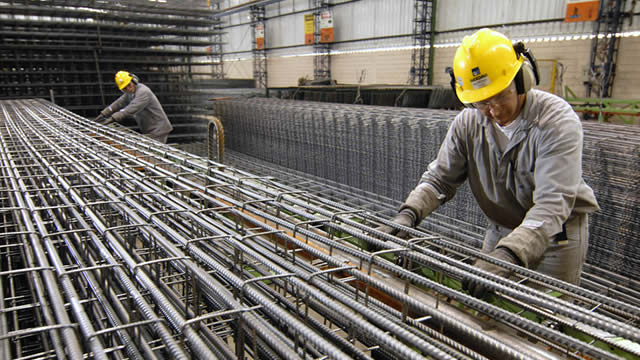
Japan's top business lobby on alert over US review of Nippon's bid for US Steel
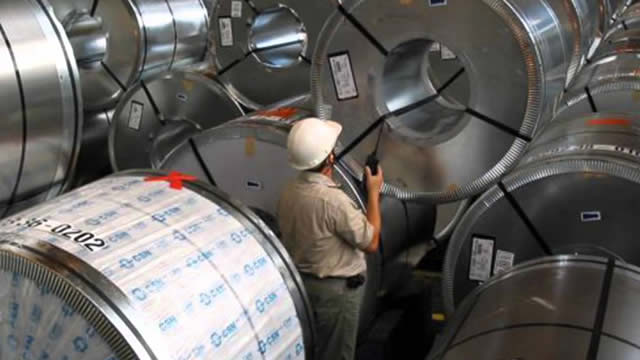
Nippon Steel pushes back on national security concerns raised by Biden admin over US Steel purchase
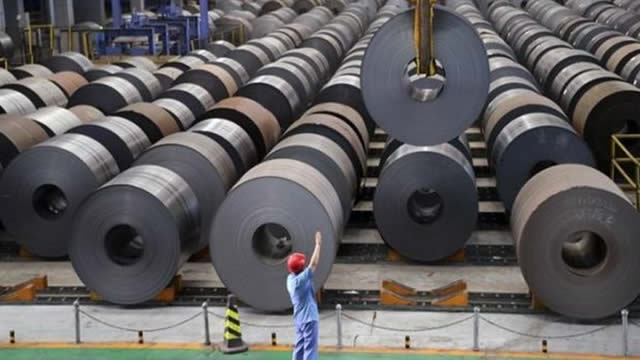
Why U.S. Steel Stock Fell This Week

Is Nippon Steel's acquisition of US Steel a real national security concern?

US Steel Stock Price Volatile as Biden Reportedly Prepares To Block Takeover

US Steel Could Collapse
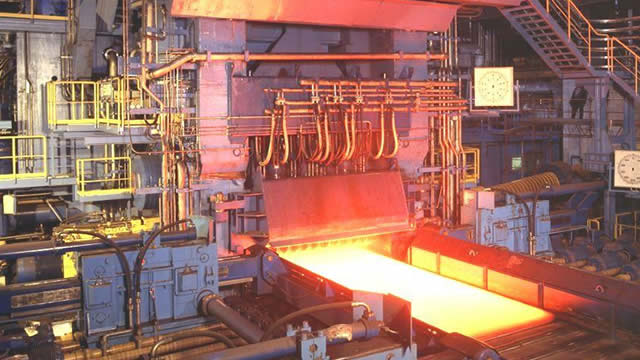
Nippon Steel says no update from CFIUS over US Steel deal
Source: https://incomestatements.info
Category: Stock Reports

What significant acquisitions has U.S. Steel made?
U.S. Steel finally acquired National Steel’s assets in 2003, after National Steel went bankrupt. As part of its diversification plan, U.S. Steel had acquired Marathon Oil on January 7, 1982, as well as Texas Oil and Gas several years later.
When was U.S. Steel founded and by whom?
US Steel was created in 1901 through a merger when a group led by J.P. Morgan and Charles Schwab, two of the world’s leading financiers of the time, bought the steel company owned by Andrew Carnegie and combined it with their holdings in its rival Federal Steel company.
What is U.S. Steel’s revenue trend over the past few years?
United States Steel annual revenue for 2023 was $18.053B, a 14.3% decline from 2022. United States Steel annual revenue for 2022 was $21.065B, a 3.9% increase from 2021. United States Steel annual revenue for 2021 was $20.275B, a 108.14% increase from 2020.