See more : Huadian Heavy Industries Co., Ltd. (601226.SS) Income Statement Analysis – Financial Results
Complete financial analysis of United States Steel Corporation (X) income statement, including revenue, profit margins, EPS and key performance metrics. Get detailed insights into the financial performance of United States Steel Corporation, a leading company in the Steel industry within the Basic Materials sector.
- Principal Financial Group, Inc. (PFG) Income Statement Analysis – Financial Results
- Nelly Group AB (publ) (NELLY.ST) Income Statement Analysis – Financial Results
- Northern Minerals & Exploration Ltd. (NMEX) Income Statement Analysis – Financial Results
- Enbridge Inc (ENB-PA.TO) Income Statement Analysis – Financial Results
- Flutter Entertainment plc (FLTR.IR) Income Statement Analysis – Financial Results
United States Steel Corporation (X)
About United States Steel Corporation
United States Steel Corporation produces and sells flat-rolled and tubular steel products primarily in North America and Europe. It operates through four segments: North American Flat-Rolled (Flat-Rolled), Mini Mill, U. S. Steel Europe (USSE), and Tubular Products (Tubular). The Flat-Rolled segment offers slabs, strip mill plates, sheets, and tin mill products, as well as iron ore and coke. This segment serves customers in the service center, conversion, transportation, automotive, construction, container, appliance, and electrical markets. The Mini Mill segment provides hot-rolled, cold-rolled, and coated sheets and electrical products. This segment serves customers in the automotive, appliance, construction, container, transportation, and service center markets. The USSE segment provides slabs, strip mill plates, sheets, tin mill products, and spiral welded pipes. This segment serves customers in the construction, container, appliance and electrical, service center, conversion, oil, gas, and petrochemical markets. The Tubular segment offers seamless and electric resistance welded steel casing and tubing products, as well as standard and line pipe and mechanical tubing products primarily to customers in the oil, gas, and petrochemical markets. The company also engages in the real estate business. United States Steel Corporation was founded in 1901 and is headquartered in Pittsburgh, Pennsylvania.
| Metric | 2023 | 2022 | 2021 | 2020 | 2019 | 2018 | 2017 | 2016 | 2015 | 2014 | 2013 | 2012 | 2011 | 2010 | 2009 | 2008 | 2007 | 2006 | 2005 | 2004 | 2003 | 2002 | 2001 | 2000 | 1999 | 1998 | 1997 | 1996 | 1995 | 1994 | 1993 | 1992 | 1991 | 1990 |
|---|---|---|---|---|---|---|---|---|---|---|---|---|---|---|---|---|---|---|---|---|---|---|---|---|---|---|---|---|---|---|---|---|---|---|
| Revenue | 18.05B | 21.07B | 20.28B | 9.74B | 12.94B | 14.18B | 12.25B | 10.26B | 11.57B | 17.51B | 17.42B | 19.33B | 19.88B | 17.37B | 11.05B | 23.82B | 16.87B | 15.72B | 14.04B | 13.97B | 9.33B | 6.95B | 6.29B | 6.13B | 5.38B | 6.18B | 6.81B | 6.55B | 6.46B | 6.07B | 5.61B | 4.95B | 4.86B | 6.07B |
| Cost of Revenue | 15.80B | 16.78B | 14.53B | 9.56B | 12.08B | 12.31B | 10.86B | 9.62B | 11.14B | 15.45B | 16.02B | 17.63B | 18.34B | 16.26B | 11.60B | 19.78B | 14.63B | 12.97B | 11.60B | 11.41B | 8.47B | 6.16B | 6.09B | 5.66B | 4.93B | 5.41B | 5.76B | 5.83B | 5.57B | 5.34B | 4.96B | 4.78B | 5.23B | 5.32B |
| Gross Profit | 2.25B | 4.29B | 5.74B | 183.00M | 855.00M | 1.87B | 1.39B | 638.00M | 433.00M | 2.06B | 1.41B | 1.70B | 1.54B | 1.12B | -549.00M | 4.04B | 2.24B | 2.75B | 2.44B | 2.56B | 859.00M | 791.00M | 195.00M | 476.00M | 452.00M | 774.00M | 1.05B | 718.00M | 891.00M | 724.00M | 650.00M | 171.00M | -364.00M | 753.00M |
| Gross Profit Ratio | 12.46% | 20.36% | 28.32% | 1.88% | 6.61% | 13.21% | 11.31% | 6.22% | 3.74% | 11.76% | 8.08% | 8.79% | 7.75% | 6.42% | -4.97% | 16.95% | 13.28% | 17.48% | 17.37% | 18.34% | 9.21% | 11.38% | 3.10% | 7.76% | 8.40% | 12.52% | 15.44% | 10.97% | 13.80% | 11.94% | 11.58% | 3.46% | -7.48% | 12.40% |
| Research & Development | 0.00 | 0.00 | 0.00 | 0.00 | 0.00 | 0.00 | 0.00 | 0.00 | 0.00 | 0.00 | 0.00 | 0.00 | 0.00 | 0.00 | 0.00 | 0.00 | 0.00 | 0.00 | 0.00 | 0.00 | 0.00 | 0.00 | 0.00 | 0.00 | 0.00 | 0.00 | 0.00 | 0.00 | 0.00 | 0.00 | 0.00 | 0.00 | 0.00 | 0.00 |
| General & Administrative | 0.00 | 0.00 | 0.00 | 0.00 | 0.00 | 336.00M | 375.00M | 255.00M | 415.00M | 523.00M | 610.00M | 654.00M | 733.00M | 610.00M | 618.00M | 625.00M | 589.00M | 604.00M | 698.00M | 739.00M | 673.00M | 418.00M | 0.00 | 0.00 | 0.00 | 0.00 | 0.00 | 0.00 | 0.00 | 0.00 | 0.00 | 0.00 | 0.00 | 0.00 |
| Selling & Marketing | 0.00 | 0.00 | 0.00 | 0.00 | 0.00 | 0.00 | 0.00 | 0.00 | -26.00M | 0.00 | 0.00 | 0.00 | 0.00 | 0.00 | 0.00 | -6.00M | 0.00 | 0.00 | 0.00 | 0.00 | 0.00 | 0.00 | 0.00 | 0.00 | 0.00 | 0.00 | 0.00 | 0.00 | 0.00 | 0.00 | 0.00 | 0.00 | 0.00 | 0.00 |
| SG&A | 501.00M | 422.00M | 426.00M | 274.00M | 289.00M | 336.00M | 375.00M | 255.00M | 389.00M | 523.00M | 610.00M | 654.00M | 733.00M | 610.00M | 618.00M | 619.00M | 589.00M | 604.00M | 698.00M | 739.00M | 673.00M | 418.00M | 92.00M | -223.00M | -283.00M | -201.00M | -137.00M | -165.00M | -134.00M | -121.00M | -108.00M | -122.00M | 0.00 | 0.00 |
| Other Expenses | 0.00 | 756.00M | 763.00M | 643.00M | 601.00M | -69.00M | 493.00M | 505.00M | 546.00M | 615.00M | 684.00M | 645.00M | 670.00M | 643.00M | 612.00M | 447.00M | 487.00M | 428.00M | 352.00M | 357.00M | 307.00M | 307.00M | 250.00M | 595.00M | 519.00M | 495.00M | 543.00M | 523.00M | 528.00M | 532.00M | 523.00M | 496.00M | 253.00M | 278.00M |
| Operating Expenses | 2.25B | 1.18B | 1.19B | 917.00M | 890.00M | 854.00M | 870.00M | 760.00M | 935.00M | 1.14B | 1.29B | 1.30B | 1.40B | 1.25B | 1.23B | 1.07B | 1.08B | 1.03B | 1.05B | 1.10B | 980.00M | 725.00M | 686.00M | 372.00M | 236.00M | 294.00M | 406.00M | 358.00M | 394.00M | 411.00M | 415.00M | 374.00M | 253.00M | 278.00M |
| Cost & Expenses | 16.15B | 17.96B | 15.72B | 10.48B | 12.97B | 13.16B | 11.73B | 10.38B | 12.08B | 16.59B | 17.31B | 18.93B | 19.75B | 17.51B | 12.83B | 20.85B | 15.71B | 14.00B | 12.65B | 12.50B | 9.45B | 6.88B | 6.78B | 6.03B | 5.16B | 5.70B | 6.17B | 6.19B | 5.96B | 5.75B | 5.38B | 5.15B | 5.48B | 5.60B |
| Interest Income | 141.00M | 44.00M | 4.00M | 7.00M | 17.00M | 23.00M | 17.00M | 5.00M | 3.00M | 12.00M | 3.00M | 7.00M | 6.00M | 7.00M | 10.00M | 14.00M | 52.00M | 57.00M | 40.00M | 14.00M | 6.00M | 5.00M | 12.00M | 3.00M | 1.00M | 0.00 | 0.00 | 0.00 | 0.00 | 0.00 | 0.00 | 0.00 | 0.00 | 0.00 |
| Interest Expense | 72.00M | 159.00M | 313.00M | 232.00M | 142.00M | 168.00M | 226.00M | 230.00M | 214.00M | 234.00M | 266.00M | 214.00M | 190.00M | 274.00M | 149.00M | 169.00M | 125.00M | 106.00M | 79.00M | 120.00M | 146.00M | 128.00M | 127.00M | 96.00M | 54.00M | 0.00 | 0.00 | 0.00 | 0.00 | 0.00 | 0.00 | 0.00 | 0.00 | 0.00 |
| Depreciation & Amortization | 916.00M | 791.00M | 791.00M | 643.00M | 616.00M | 521.00M | 501.00M | 507.00M | 547.00M | 627.00M | 684.00M | 661.00M | 681.00M | 658.00M | 661.00M | 605.00M | 506.00M | 441.00M | 366.00M | 382.00M | 363.00M | 350.00M | 344.00M | 360.00M | 304.00M | 283.00M | 303.00M | 292.00M | 318.00M | 314.00M | 314.00M | 288.00M | 253.00M | 278.00M |
| EBITDA | 2.04B | 4.21B | 5.45B | -384.00M | 306.00M | 1.50B | 1.03B | 321.00M | -698.00M | 1.03B | -1.28B | 897.00M | 898.00M | 468.00M | -1.02B | 3.83B | 1.77B | 2.28B | 1.79B | 1.98B | -497.00M | 491.00M | -75.00M | 455.00M | 434.00M | 862.00M | 949.00M | 638.00M | 815.00M | 627.00M | 549.00M | 85.00M | -364.00M | 753.00M |
| EBITDA Ratio | 11.27% | 19.46% | 25.81% | -1.85% | 6.61% | 10.82% | 7.93% | 5.13% | 5.50% | 12.54% | 16.37% | 7.02% | 3.99% | 2.95% | -11.24% | 14.95% | 10.15% | 14.19% | 12.94% | 13.42% | 2.43% | 6.42% | -1.54% | 9.28% | 10.89% | 10.74% | 12.00% | 8.02% | 11.18% | 8.90% | 11.83% | 2.02% | -7.67% | 11.44% |
| Operating Income | 1.90B | 3.31B | 4.44B | -823.00M | 239.00M | 1.02B | 608.00M | -165.00M | -1.06B | 413.00M | -1.90B | 247.00M | 248.00M | -111.00M | -1.68B | 3.10B | 1.21B | 1.79B | 1.44B | 1.58B | -730.00M | 128.00M | -405.00M | 104.00M | 216.00M | 480.00M | 646.00M | 360.00M | 497.00M | 313.00M | 235.00M | -203.00M | -617.00M | 475.00M |
| Operating Income Ratio | 10.54% | 15.71% | 21.90% | -8.45% | 1.85% | 7.19% | 4.96% | -1.61% | -9.12% | 2.36% | -10.90% | 1.28% | 1.25% | -0.64% | -15.24% | 13.00% | 7.19% | 11.36% | 10.25% | 11.31% | -7.83% | 1.84% | -6.44% | 1.70% | 4.01% | 7.76% | 9.48% | 5.50% | 7.70% | 5.16% | 4.19% | -4.10% | -12.69% | 7.82% |
| Total Other Income/Expenses | -856.00M | -853.00M | -1.02B | -240.00M | -222.00M | -226.00M | -263.00M | -292.00M | -14.00M | -243.00M | -332.00M | -241.00M | -238.00M | -274.00M | -161.00M | -62.00M | -105.00M | 21.00M | -127.00M | -119.00M | -96.00M | -115.00M | -141.00M | -105.00M | -74.00M | 57.00M | 40.00M | 7.00M | -44.00M | -65.00M | -445.00M | -191.00M | -139.00M | -38.00M |
| Income Before Tax | 1.05B | 3.26B | 4.34B | -1.31B | -452.00M | 812.00M | 301.00M | -416.00M | -1.31B | 170.00M | -2.23B | 6.00M | 9.00M | -385.00M | -1.85B | 3.03B | 1.11B | 1.72B | 1.31B | 1.46B | -860.00M | 13.00M | -546.00M | -1.00M | 76.00M | 537.00M | 686.00M | 367.00M | 453.00M | 248.00M | -210.00M | -394.00M | -756.00M | 437.00M |
| Income Before Tax Ratio | 5.80% | 15.47% | 21.43% | -13.42% | -3.49% | 5.73% | 2.46% | -4.05% | -11.34% | 0.97% | -12.81% | 0.03% | 0.05% | -2.22% | -16.70% | 12.74% | 6.57% | 10.96% | 9.35% | 10.46% | -9.22% | 0.19% | -8.69% | -0.02% | 1.41% | 8.68% | 10.07% | 5.61% | 7.02% | 4.09% | -3.74% | -7.96% | -15.54% | 7.20% |
| Income Tax Expense | 152.00M | 735.00M | 170.00M | -142.00M | 190.00M | -303.00M | -86.00M | 24.00M | 196.00M | 68.00M | -168.00M | 131.00M | 77.00M | 97.00M | -439.00M | 862.00M | 218.00M | 324.00M | 365.00M | 351.00M | -454.00M | -48.00M | -328.00M | 20.00M | 25.00M | 173.00M | 234.00M | 92.00M | 150.00M | 47.00M | -41.00M | -123.00M | -249.00M | 127.00M |
| Net Income | 895.00M | 2.52B | 4.17B | -1.17B | -642.00M | 1.12B | 387.00M | -440.00M | -1.51B | 102.00M | -2.06B | -124.00M | -68.00M | -482.00M | -1.40B | 2.11B | 879.00M | 1.37B | 910.00M | 1.14B | -463.00M | 61.00M | -218.00M | -21.00M | 44.00M | 364.00M | 452.00M | 273.00M | 301.00M | 201.00M | -238.00M | -1.61B | -507.00M | 310.00M |
| Net Income Ratio | 4.96% | 11.98% | 20.59% | -11.96% | -4.96% | 7.86% | 3.16% | -4.29% | -13.03% | 0.58% | -11.85% | -0.64% | -0.34% | -2.77% | -12.68% | 8.87% | 5.21% | 8.74% | 6.48% | 8.13% | -4.96% | 0.88% | -3.47% | -0.34% | 0.82% | 5.89% | 6.63% | 4.17% | 4.66% | 3.31% | -4.24% | -32.46% | -10.42% | 5.10% |
| EPS | 4.04 | 10.22 | 15.77 | -5.92 | -3.75 | 6.31 | 2.21 | -2.81 | -10.32 | 0.71 | -14.28 | -0.86 | -0.47 | -3.36 | -10.42 | 18.04 | 7.44 | 11.88 | 7.87 | 10.00 | -4.49 | 0.62 | -2.44 | -0.24 | 0.40 | 4.05 | 5.24 | 2.98 | 3.51 | 2.35 | -3.71 | -28.80 | -9.96 | 6.00 |
| EPS Diluted | 3.56 | 9.16 | 14.88 | -5.92 | -3.75 | 6.25 | 2.19 | -2.81 | -10.32 | 0.69 | -14.28 | -0.86 | -0.47 | -3.36 | -10.42 | 17.96 | 7.40 | 11.18 | 7.00 | 8.83 | -4.49 | 0.62 | -2.44 | -0.24 | 0.40 | 3.92 | 4.88 | 2.95 | 3.41 | 2.33 | -3.71 | -28.80 | -9.96 | 6.00 |
| Weighted Avg Shares Out | 224.76M | 246.99M | 264.67M | 196.72M | 171.42M | 176.63M | 174.79M | 156.58M | 146.09M | 145.16M | 144.58M | 144.19M | 143.97M | 143.57M | 134.47M | 117.10M | 118.09M | 114.92M | 113.34M | 111.70M | 103.18M | 97.43M | 89.22M | 89.22M | 87.50M | 87.65M | 83.78M | 84.23M | 78.92M | 74.89M | 64.11M | 55.77M | 50.90M | 51.00M |
| Weighted Avg Shares Out (Dil) | 255.36M | 276.96M | 280.44M | 196.72M | 171.42M | 178.46M | 176.52M | 156.67M | 146.09M | 152.10M | 144.58M | 144.24M | 143.97M | 143.57M | 134.47M | 117.62M | 118.82M | 122.92M | 127.43M | 126.50M | 103.18M | 97.43M | 89.22M | 89.22M | 87.50M | 90.56M | 89.96M | 85.08M | 81.23M | 75.54M | 64.11M | 55.77M | 50.90M | 51.00M |
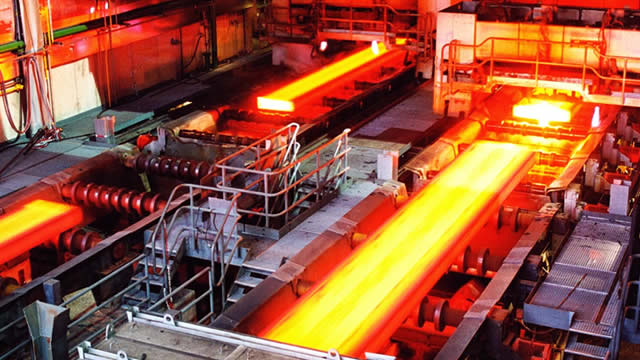
Arbitration board gives green light to US Steel-Nippon Steel merger over union's objections
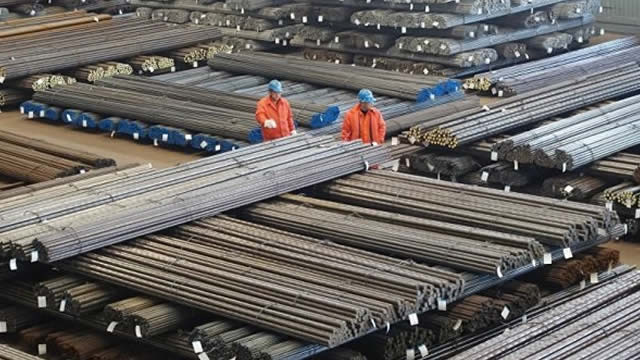
US Steel says arbitration board rules in favor of Nippon Steel's $14.9 bln buyout deal

Board of Arbitration Rules in Favor of U. S. Steel, Affirming Transaction with Nippon Steel
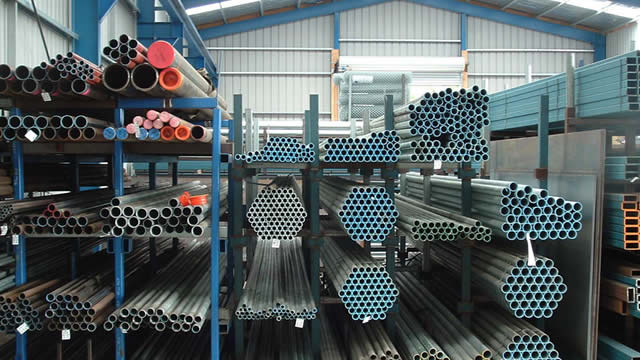
US Steel CEO asserts confidence in $14.9 billion sale to Nippon Steel amid political pushback
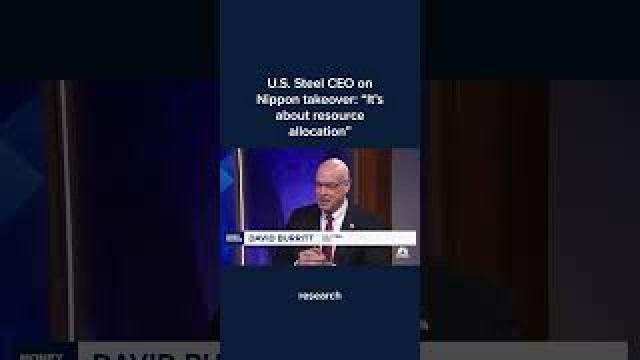
U.S. Steel CEO on Nippon takeover: 'It's about resource allocation'
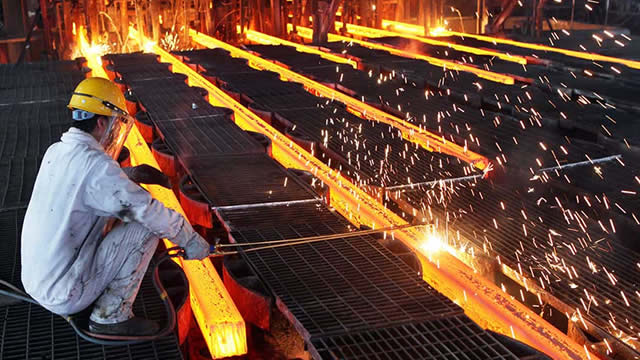
U.S. Steel CEO defends planned sale to Japan's Nippon, believes deal will ‘close on its merits'

U.S. Steel CEO defends sale to Nippon, says deal will 'win on its merits'

Looking for Stocks with Positive Earnings Momentum? Check Out These 2 Basic Materials Names

U. S. Steel Earns World's First Ever Certification for ResponsibleSteel™ Certified Steel at its Big River Steel Operation
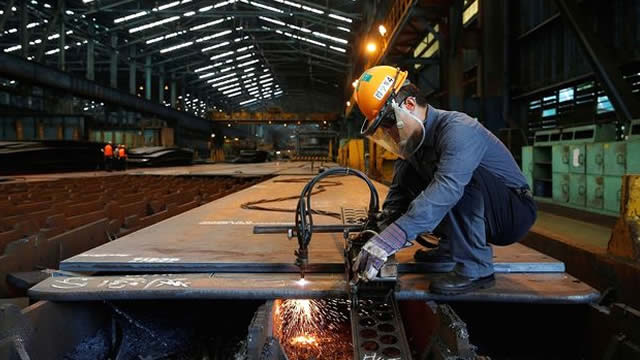
U.S. Steel Projects Strong Q3 Despite Tubular and European Headwinds
Source: https://incomestatements.info
Category: Stock Reports
