See more : Speedus Corp. (SPDE) Income Statement Analysis – Financial Results
Complete financial analysis of Applied Materials, Inc. (AMAT) income statement, including revenue, profit margins, EPS and key performance metrics. Get detailed insights into the financial performance of Applied Materials, Inc., a leading company in the Semiconductors industry within the Technology sector.
- DuZhe Publish&Media Co.,Ltd (603999.SS) Income Statement Analysis – Financial Results
- B2B Software Technologies Limited (B2BSOFT.BO) Income Statement Analysis – Financial Results
- Acelyrin, Inc. (SLRN) Income Statement Analysis – Financial Results
- Amic Forging Limited (AMIC.BO) Income Statement Analysis – Financial Results
- Centamin plc (CELTF) Income Statement Analysis – Financial Results
Applied Materials, Inc. (AMAT)
About Applied Materials, Inc.
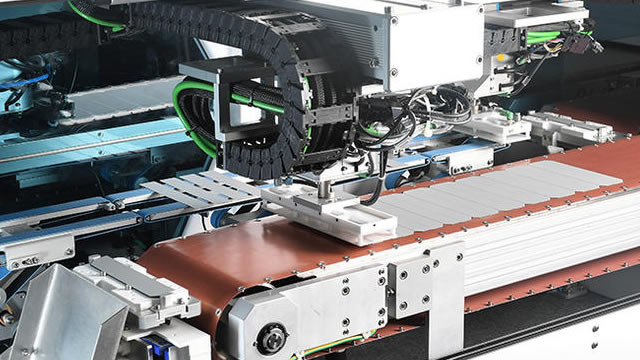
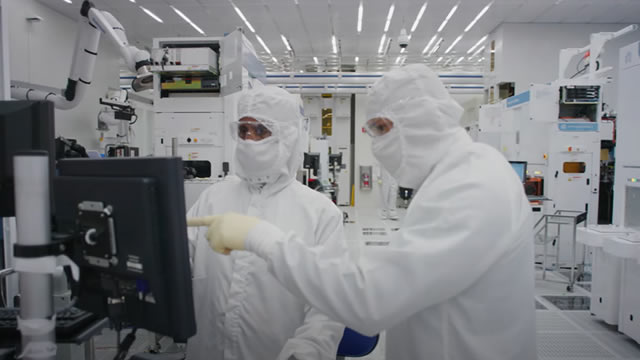
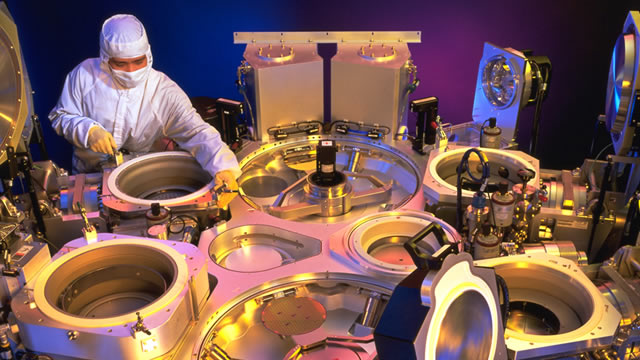
Applied Materials, Inc. provides manufacturing equipment, services, and software to the semiconductor, display, and related industries. It operates through three segments: Semiconductor Systems, Applied Global Services, and Display and Adjacent Markets. The Semiconductor Systems segment develops, manufactures, and sells various manufacturing equipment that is used to fabricate semiconductor chips or integrated circuits. This segment also offers various technologies, including epitaxy, ion implantation, oxidation/nitridation, rapid thermal processing, physical vapor deposition, chemical vapor deposition, chemical mechanical planarization, electrochemical deposition, atomic layer deposition, etching, and selective deposition and removal, as well as metrology and inspection tools. The Applied Global Services segment provides integrated solutions to optimize equipment and fab performance and productivity comprising spares, upgrades, services, remanufactured earlier generation equipment, and factory automation software for semiconductor, display, and other products. The Display and Adjacent Markets segment offers products for manufacturing liquid crystal displays; organic light-emitting diodes; and other display technologies for TVs, monitors, laptops, personal computers, electronic tablets, smart phones, and other consumer-oriented devices. The company operates in the United States, China, Korea, Taiwan, Japan, Southeast Asia, and Europe. Applied Materials, Inc. was incorporated in 1967 and is headquartered in Santa Clara, California.
| Metric | 2024 | 2023 | 2022 | 2021 | 2020 | 2019 | 2018 | 2017 | 2016 | 2015 | 2014 | 2013 | 2012 | 2011 | 2010 | 2009 | 2008 | 2007 | 2006 | 2005 | 2004 | 2003 | 2002 | 2001 | 2000 | 1999 | 1998 | 1997 | 1996 | 1995 | 1994 | 1993 | 1992 | 1991 | 1990 | 1989 | 1988 | 1987 | 1986 | 1985 |
|---|---|---|---|---|---|---|---|---|---|---|---|---|---|---|---|---|---|---|---|---|---|---|---|---|---|---|---|---|---|---|---|---|---|---|---|---|---|---|---|---|
| Revenue | 27.18B | 26.52B | 25.79B | 23.06B | 17.20B | 14.61B | 17.25B | 14.54B | 10.83B | 9.66B | 9.07B | 7.51B | 8.72B | 10.52B | 9.55B | 5.01B | 8.13B | 9.73B | 9.17B | 6.99B | 8.01B | 4.48B | 5.06B | 7.34B | 9.56B | 4.86B | 4.04B | 4.07B | 4.14B | 3.06B | 1.66B | 1.08B | 751.40M | 638.60M | 567.10M | 501.80M | 362.80M | 174.40M | 149.30M | 174.60M |
| Cost of Revenue | 14.28B | 14.13B | 13.79B | 12.15B | 9.51B | 8.22B | 9.44B | 8.01B | 6.31B | 5.71B | 5.23B | 4.52B | 5.41B | 6.16B | 5.83B | 3.58B | 4.69B | 5.24B | 4.88B | 3.91B | 4.31B | 2.87B | 3.01B | 4.09B | 4.71B | 2.54B | 2.18B | 2.17B | 2.20B | 1.65B | 891.50M | 565.50M | 414.30M | 345.50M | 286.00M | 245.40M | 180.70M | 93.80M | 81.10M | 89.00M |
| Gross Profit | 12.90B | 12.38B | 11.99B | 10.91B | 7.69B | 6.39B | 7.82B | 6.53B | 4.51B | 3.95B | 3.84B | 2.99B | 3.31B | 4.36B | 3.72B | 1.43B | 3.44B | 4.49B | 4.29B | 3.09B | 3.70B | 1.60B | 2.06B | 3.25B | 4.86B | 2.32B | 1.86B | 1.90B | 1.95B | 1.41B | 768.30M | 514.50M | 337.10M | 293.10M | 281.10M | 256.40M | 182.10M | 80.60M | 68.20M | 85.60M |
| Gross Profit Ratio | 47.46% | 46.70% | 46.51% | 47.32% | 44.72% | 43.72% | 45.31% | 44.93% | 41.67% | 40.92% | 42.36% | 39.83% | 38.00% | 41.46% | 38.91% | 28.54% | 42.35% | 46.15% | 46.82% | 44.14% | 46.19% | 35.84% | 40.63% | 44.29% | 50.77% | 47.78% | 46.10% | 46.66% | 47.04% | 46.05% | 46.29% | 47.64% | 44.86% | 45.90% | 49.57% | 51.10% | 50.19% | 46.22% | 45.68% | 49.03% |
| Research & Development | 3.23B | 3.10B | 2.77B | 2.49B | 2.23B | 2.05B | 2.02B | 1.77B | 1.54B | 1.45B | 1.43B | 1.32B | 1.24B | 1.12B | 1.14B | 934.12M | 1.10B | 1.14B | 1.15B | 940.51M | 991.87M | 920.62M | 1.05B | 1.20B | 1.11B | 681.80M | 643.90M | 567.60M | 481.40M | 329.70M | 189.10M | 0.00 | 0.00 | 0.00 | 0.00 | 0.00 | 0.00 | 0.00 | 0.00 | 0.00 |
| General & Administrative | 961.00M | 852.00M | 735.00M | 620.00M | 567.00M | 461.00M | 481.00M | 434.00M | 390.00M | 469.00M | 467.00M | 465.00M | 514.00M | 0.00 | 535.82M | 406.95M | 0.00 | 0.00 | 0.00 | 0.00 | 0.00 | 0.00 | 0.00 | 0.00 | 0.00 | 0.00 | 0.00 | 0.00 | 0.00 | 0.00 | 0.00 | 0.00 | 0.00 | 0.00 | 0.00 | 0.00 | 0.00 | 0.00 | 0.00 | 0.00 |
| Selling & Marketing | 836.00M | 776.00M | 703.00M | 609.00M | 526.00M | 521.00M | 521.00M | 456.00M | 429.00M | 428.00M | 423.00M | 433.00M | 481.00M | 0.00 | 406.03M | 327.57M | 0.00 | 0.00 | 0.00 | 0.00 | 0.00 | 0.00 | 0.00 | 0.00 | 0.00 | 0.00 | 0.00 | 0.00 | 0.00 | 0.00 | 0.00 | 0.00 | 0.00 | 0.00 | 0.00 | 0.00 | 0.00 | 0.00 | 0.00 | 0.00 |
| SG&A | 1.80B | 1.63B | 1.44B | 1.23B | 1.09B | 982.00M | 1.00B | 890.00M | 819.00M | 897.00M | 890.00M | 898.00M | 1.08B | 901.00M | 941.85M | 734.52M | 965.16M | 952.44M | 906.74M | 697.40M | 751.62M | 625.87M | 708.96M | 901.92M | 960.75M | 658.00M | 593.70M | 566.60M | 539.70M | 386.20M | 242.00M | 311.80M | 235.60M | 215.90M | 206.20M | 161.20M | 100.10M | 69.30M | 56.40M | 64.30M |
| Other Expenses | 0.00 | 0.00 | 0.00 | 311.00M | 0.00 | 0.00 | 0.00 | 0.00 | 0.00 | 0.00 | 0.00 | 0.00 | 0.00 | 0.00 | 0.00 | 0.00 | 0.00 | 0.00 | 572.66M | 0.00 | 26.63M | 0.00 | 85.48M | 221.16M | 0.00 | 48.30M | 237.20M | 16.30M | 0.00 | 0.00 | 0.00 | 38.90M | 28.90M | 24.50M | 16.00M | 11.70M | 11.40M | 9.30M | 7.80M | 5.20M |
| Operating Expenses | 5.03B | 4.73B | 4.21B | 3.71B | 3.33B | 3.04B | 3.02B | 2.66B | 2.36B | 2.35B | 2.32B | 2.22B | 2.31B | 1.99B | 2.09B | 1.67B | 2.07B | 2.09B | 2.63B | 1.64B | 1.77B | 1.55B | 1.85B | 2.32B | 1.91B | 1.39B | 1.47B | 1.15B | 1.02B | 715.90M | 429.10M | 350.70M | 264.50M | 240.40M | 222.20M | 172.90M | 111.50M | 78.60M | 64.20M | 69.50M |
| Cost & Expenses | 19.31B | 18.86B | 18.00B | 15.86B | 12.84B | 11.26B | 12.46B | 10.67B | 8.67B | 8.06B | 7.55B | 6.74B | 7.72B | 8.15B | 7.92B | 5.25B | 6.76B | 7.34B | 7.51B | 5.54B | 6.08B | 4.42B | 4.85B | 6.41B | 6.62B | 3.93B | 3.65B | 3.32B | 3.22B | 2.37B | 1.32B | 916.20M | 678.80M | 585.90M | 508.20M | 418.30M | 292.20M | 172.40M | 145.30M | 158.50M |
| Interest Income | 0.00 | 300.00M | 39.00M | 118.00M | 41.00M | 156.00M | 132.00M | 61.00M | 16.00M | 8.00M | 23.00M | 19.00M | 17.00M | 42.00M | 37.43M | 48.58M | 109.32M | 136.15M | 0.00 | 0.00 | 0.00 | 0.00 | 0.00 | 0.00 | 0.00 | 0.00 | 0.00 | 0.00 | 0.00 | 0.00 | 0.00 | 0.00 | 0.00 | 0.00 | 0.00 | 0.00 | 0.00 | 0.00 | 0.00 | 0.00 |
| Interest Expense | 247.00M | 238.00M | 228.00M | 236.00M | 240.00M | 237.00M | 234.00M | 198.00M | 155.00M | 103.00M | 95.00M | 95.00M | 95.00M | 59.00M | 21.51M | 21.30M | 20.51M | 38.63M | 0.00 | 0.00 | 0.00 | 0.00 | 0.00 | 0.00 | 0.00 | 0.00 | 0.00 | 0.00 | 0.00 | 0.00 | 0.00 | 0.00 | 0.00 | 0.00 | 0.00 | 0.00 | 0.00 | 0.00 | 0.00 | 0.00 |
| Depreciation & Amortization | 392.00M | 515.00M | 444.00M | 394.00M | 376.00M | 363.00M | 457.00M | 407.00M | 389.00M | 371.00M | 375.00M | 410.00M | 422.00M | 246.00M | 304.52M | 291.20M | 320.05M | 268.33M | 270.41M | 300.58M | 356.99M | 384.39M | 387.53M | 386.97M | 361.97M | 275.40M | 284.50M | 219.40M | 148.90M | 83.20M | 59.10M | 38.90M | 28.90M | 24.50M | 16.00M | 11.70M | 11.40M | 9.30M | 7.80M | 5.20M |
| EBITDA | 8.26B | 8.17B | 8.23B | 7.59B | 4.84B | 3.74B | 4.95B | 4.34B | 2.54B | 2.07B | 1.94B | 1.19B | 1.52B | 2.68B | 1.71B | -173.30M | 1.75B | 2.75B | 2.47B | 1.75B | 2.29B | 442.36M | 682.96M | 1.32B | 3.31B | 1.27B | 986.21M | 969.80M | 1.08B | 777.20M | 398.30M | 202.70M | 101.50M | 77.20M | 74.90M | 95.20M | 82.00M | 11.30M | 11.80M | 21.30M |
| EBITDA Ratio | 28.95% | 30.81% | 32.06% | 33.44% | 27.80% | 26.49% | 31.21% | 29.83% | 23.62% | 20.53% | 21.20% | 16.01% | 16.50% | 25.25% | 20.65% | -2.03% | 21.06% | 27.66% | 23.37% | 25.01% | 30.98% | 18.18% | 13.49% | 20.95% | 34.31% | 24.57% | 22.15% | 23.97% | 26.60% | 25.38% | 23.87% | 18.70% | 13.31% | 11.84% | 12.87% | 18.79% | 22.77% | 5.45% | 9.11% | 12.20% |
| Operating Income | 7.87B | 7.65B | 7.79B | 6.89B | 4.37B | 3.35B | 4.80B | 3.87B | 2.15B | 1.69B | 1.52B | 432.00M | 411.00M | 2.40B | 1.38B | -393.62M | 1.33B | 2.37B | 1.45B | 1.45B | 1.76B | -313.78M | 209.96M | 930.15M | 2.95B | 933.70M | 388.40M | 690.90M | 903.60M | 693.90M | 339.20M | 163.80M | 72.60M | 52.70M | 58.90M | 83.50M | 70.60M | 2.00M | 4.00M | 16.10M |
| Operating Income Ratio | 28.95% | 28.86% | 30.20% | 29.87% | 25.37% | 22.93% | 27.80% | 26.61% | 19.88% | 17.53% | 16.75% | 5.75% | 4.71% | 22.80% | 14.49% | -7.85% | 16.40% | 24.36% | 15.80% | 20.71% | 22.01% | -7.01% | 4.15% | 12.67% | 30.82% | 19.22% | 9.61% | 16.96% | 21.80% | 22.66% | 20.44% | 15.17% | 9.66% | 8.25% | 10.39% | 16.64% | 19.46% | 1.15% | 2.68% | 9.22% |
| Total Other Income/Expenses | 285.00M | 62.00M | -189.00M | -118.00M | -199.00M | -81.00M | -95.00M | -205.00M | -139.00M | -95.00M | -72.00M | -82.00M | -778.00M | -20.00M | 2.97M | -275.34M | 53.29M | -19.27M | 719.01M | 133.60M | -128.50M | 102.23M | 130.55M | 173.66M | 0.00 | 89.64M | -221.09M | 108.00M | -6.10M | 4.60M | -4.70M | -13.40M | -13.70M | -12.40M | -4.80M | 900.00K | -3.90M | -1.50M | -1.90M | -100.00K |
| Income Before Tax | 8.15B | 7.72B | 7.60B | 6.77B | 4.17B | 3.27B | 4.69B | 3.73B | 2.01B | 1.60B | 1.45B | 350.00M | 316.00M | 2.38B | 1.39B | -485.80M | 1.41B | 2.44B | 2.17B | 1.58B | 1.83B | -211.56M | 340.51M | 1.10B | 2.95B | 1.02B | 437.80M | 798.90M | 599.60M | 698.50M | 334.50M | 150.40M | 58.90M | 40.30M | 54.10M | 84.40M | 66.70M | 500.00K | 2.10M | 16.00M |
| Income Before Tax Ratio | 30.00% | 29.10% | 29.47% | 29.36% | 24.22% | 22.38% | 27.21% | 25.67% | 18.60% | 16.54% | 15.96% | 4.66% | 3.62% | 22.61% | 14.53% | -9.69% | 17.33% | 25.06% | 23.64% | 22.62% | 22.83% | -4.73% | 6.73% | 15.03% | 30.82% | 21.03% | 10.83% | 19.61% | 14.47% | 22.81% | 20.15% | 13.93% | 7.84% | 6.31% | 9.54% | 16.82% | 18.38% | 0.29% | 1.41% | 9.16% |
| Income Tax Expense | 975.00M | 860.00M | 1.07B | 883.00M | 547.00M | 563.00M | 1.38B | 297.00M | 292.00M | 221.00M | 342.00M | 94.00M | 207.00M | 452.00M | 449.10M | -180.48M | 447.97M | 729.46M | 650.31M | 371.67M | 477.95M | -62.41M | 71.51M | 328.57M | 884.29M | 329.90M | 148.90M | 300.40M | 322.90M | 244.50M | 117.10M | 50.70M | 19.40M | 14.10M | 20.00M | 32.90M | 26.70M | 200.00K | 900.00K | 6.70M |
| Net Income | 7.18B | 6.86B | 6.53B | 5.89B | 3.62B | 2.71B | 3.31B | 3.43B | 1.72B | 1.38B | 1.11B | 256.00M | 109.00M | 1.93B | 937.87M | -305.33M | 960.75M | 1.71B | 1.52B | 1.21B | 1.35B | -149.15M | 269.00M | 775.23M | 2.06B | 746.70M | 230.90M | 498.50M | 599.60M | 454.10M | 220.70M | 99.70M | 39.50M | 26.20M | 34.10M | 51.50M | 40.00M | 300.00K | 1.20M | 9.30M |
| Net Income Ratio | 26.41% | 25.86% | 25.31% | 25.53% | 21.04% | 18.52% | 19.20% | 23.62% | 15.90% | 14.26% | 12.19% | 3.41% | 1.25% | 18.31% | 9.82% | -6.09% | 11.82% | 17.57% | 16.54% | 17.30% | 16.86% | -3.33% | 5.31% | 10.56% | 21.58% | 15.37% | 5.71% | 12.24% | 14.47% | 14.83% | 13.30% | 9.23% | 5.26% | 4.10% | 6.01% | 10.26% | 11.03% | 0.17% | 0.80% | 5.33% |
| EPS | 8.68 | 8.16 | 7.49 | 6.47 | 3.95 | 2.89 | 3.27 | 3.20 | 1.56 | 1.13 | 0.91 | 0.21 | 0.09 | 1.46 | 0.70 | -0.23 | 0.71 | 1.22 | 0.98 | 0.75 | 0.80 | -0.09 | 0.16 | 0.31 | 1.28 | 0.48 | 0.16 | 0.33 | 0.42 | 0.32 | 0.17 | 0.08 | 0.04 | 0.03 | 0.04 | 0.05 | 0.04 | 0.01 | 0.01 | 0.02 |
| EPS Diluted | 8.61 | 8.11 | 7.44 | 6.41 | 3.92 | 2.86 | 3.23 | 3.17 | 1.54 | 1.12 | 0.90 | 0.21 | 0.09 | 1.45 | 0.70 | -0.23 | 0.70 | 1.20 | 0.97 | 0.73 | 0.78 | -0.09 | 0.16 | 0.30 | 1.20 | 0.46 | 0.15 | 0.33 | 0.41 | 0.32 | 0.17 | 0.08 | 0.04 | 0.03 | 0.04 | 0.05 | 0.04 | 0.01 | 0.01 | 0.02 |
| Weighted Avg Shares Out | 827.00M | 840.00M | 871.00M | 910.00M | 916.00M | 937.00M | 1.01B | 1.07B | 1.11B | 1.21B | 1.22B | 1.20B | 1.27B | 1.32B | 1.34B | 1.33B | 1.35B | 1.41B | 1.55B | 1.65B | 1.69B | 1.66B | 1.64B | 1.63B | 1.61B | 1.56B | 1.47B | 3.02B | 1.43B | 2.84B | 1.36B | 1.25B | 1.13B | 1.05B | 974.29M | 1.03B | 1.00B | 990.27M | 840.45M | 620.00M |
| Weighted Avg Shares Out (Dil) | 834.00M | 845.00M | 877.00M | 919.00M | 923.00M | 945.00M | 1.03B | 1.08B | 1.12B | 1.23B | 1.23B | 1.22B | 1.28B | 1.33B | 1.35B | 1.33B | 1.37B | 1.43B | 1.57B | 1.66B | 1.72B | 1.66B | 1.70B | 1.69B | 1.72B | 1.64B | 1.51B | 3.02B | 1.46B | 2.84B | 1.36B | 1.25B | 1.13B | 1.05B | 974.29M | 1.03B | 1.00B | 990.27M | 840.45M | 620.00M |

Applied Materials Plunges 21% in Six Months: How to Play the Stock?

Missed Out on Investing in Nvidia? Here's 1 Artificial Intelligence (AI) Chip Stock to Buy on the Dip

SHAREHOLDER ALERT: Pomerantz Law Firm Investigates Claims On Behalf of Investors of Applied Materials, Inc. - AMAT

Applied Materials Breakthrough To Bring OLED Displays to Tablets, PCs and TVs
Is It Finally Time to Buy This Incredibly Cheap Semiconductor Stock Following Its Latest Crash?

Applied Materials' Blueprint For Margin Expansion And Long-Term Growth

SHAREHOLDER ALERT: Pomerantz Law Firm Investigates Claims On Behalf of Investors of Applied Materials, Inc. - AMAT

Stock Split Watch: Is Applied Materials Next?

Applied Materials Announces New Collaboration Model for Advanced Packaging at Summit on Energy-Efficient Computing

SHAREHOLDER ALERT: Pomerantz Law Firm Investigates Claims On Behalf of Investors of Applied Materials, Inc. - AMAT
Source: https://incomestatements.info
Category: Stock Reports
