See more : Ragnar Metals Limited (RAG.AX) Income Statement Analysis – Financial Results
Complete financial analysis of Applied Materials, Inc. (AMAT) income statement, including revenue, profit margins, EPS and key performance metrics. Get detailed insights into the financial performance of Applied Materials, Inc., a leading company in the Semiconductors industry within the Technology sector.
- Abirami Financial Services (India) Limited (ABIRAFN.BO) Income Statement Analysis – Financial Results
- Alpha Divisions Public Company Limited (ALPHAX.BK) Income Statement Analysis – Financial Results
- Zhongyan Technology Co., Ltd. (003001.SZ) Income Statement Analysis – Financial Results
- Daekyo Co., Ltd. (019685.KS) Income Statement Analysis – Financial Results
- Guerbet SA (0ELV.L) Income Statement Analysis – Financial Results
Applied Materials, Inc. (AMAT)
About Applied Materials, Inc.
Applied Materials, Inc. provides manufacturing equipment, services, and software to the semiconductor, display, and related industries. It operates through three segments: Semiconductor Systems, Applied Global Services, and Display and Adjacent Markets. The Semiconductor Systems segment develops, manufactures, and sells various manufacturing equipment that is used to fabricate semiconductor chips or integrated circuits. This segment also offers various technologies, including epitaxy, ion implantation, oxidation/nitridation, rapid thermal processing, physical vapor deposition, chemical vapor deposition, chemical mechanical planarization, electrochemical deposition, atomic layer deposition, etching, and selective deposition and removal, as well as metrology and inspection tools. The Applied Global Services segment provides integrated solutions to optimize equipment and fab performance and productivity comprising spares, upgrades, services, remanufactured earlier generation equipment, and factory automation software for semiconductor, display, and other products. The Display and Adjacent Markets segment offers products for manufacturing liquid crystal displays; organic light-emitting diodes; and other display technologies for TVs, monitors, laptops, personal computers, electronic tablets, smart phones, and other consumer-oriented devices. The company operates in the United States, China, Korea, Taiwan, Japan, Southeast Asia, and Europe. Applied Materials, Inc. was incorporated in 1967 and is headquartered in Santa Clara, California.
| Metric | 2024 | 2023 | 2022 | 2021 | 2020 | 2019 | 2018 | 2017 | 2016 | 2015 | 2014 | 2013 | 2012 | 2011 | 2010 | 2009 | 2008 | 2007 | 2006 | 2005 | 2004 | 2003 | 2002 | 2001 | 2000 | 1999 | 1998 | 1997 | 1996 | 1995 | 1994 | 1993 | 1992 | 1991 | 1990 | 1989 | 1988 | 1987 | 1986 | 1985 |
|---|---|---|---|---|---|---|---|---|---|---|---|---|---|---|---|---|---|---|---|---|---|---|---|---|---|---|---|---|---|---|---|---|---|---|---|---|---|---|---|---|
| Revenue | 27.18B | 26.52B | 25.79B | 23.06B | 17.20B | 14.61B | 17.25B | 14.54B | 10.83B | 9.66B | 9.07B | 7.51B | 8.72B | 10.52B | 9.55B | 5.01B | 8.13B | 9.73B | 9.17B | 6.99B | 8.01B | 4.48B | 5.06B | 7.34B | 9.56B | 4.86B | 4.04B | 4.07B | 4.14B | 3.06B | 1.66B | 1.08B | 751.40M | 638.60M | 567.10M | 501.80M | 362.80M | 174.40M | 149.30M | 174.60M |
| Cost of Revenue | 14.28B | 14.13B | 13.79B | 12.15B | 9.51B | 8.22B | 9.44B | 8.01B | 6.31B | 5.71B | 5.23B | 4.52B | 5.41B | 6.16B | 5.83B | 3.58B | 4.69B | 5.24B | 4.88B | 3.91B | 4.31B | 2.87B | 3.01B | 4.09B | 4.71B | 2.54B | 2.18B | 2.17B | 2.20B | 1.65B | 891.50M | 565.50M | 414.30M | 345.50M | 286.00M | 245.40M | 180.70M | 93.80M | 81.10M | 89.00M |
| Gross Profit | 12.90B | 12.38B | 11.99B | 10.91B | 7.69B | 6.39B | 7.82B | 6.53B | 4.51B | 3.95B | 3.84B | 2.99B | 3.31B | 4.36B | 3.72B | 1.43B | 3.44B | 4.49B | 4.29B | 3.09B | 3.70B | 1.60B | 2.06B | 3.25B | 4.86B | 2.32B | 1.86B | 1.90B | 1.95B | 1.41B | 768.30M | 514.50M | 337.10M | 293.10M | 281.10M | 256.40M | 182.10M | 80.60M | 68.20M | 85.60M |
| Gross Profit Ratio | 47.46% | 46.70% | 46.51% | 47.32% | 44.72% | 43.72% | 45.31% | 44.93% | 41.67% | 40.92% | 42.36% | 39.83% | 38.00% | 41.46% | 38.91% | 28.54% | 42.35% | 46.15% | 46.82% | 44.14% | 46.19% | 35.84% | 40.63% | 44.29% | 50.77% | 47.78% | 46.10% | 46.66% | 47.04% | 46.05% | 46.29% | 47.64% | 44.86% | 45.90% | 49.57% | 51.10% | 50.19% | 46.22% | 45.68% | 49.03% |
| Research & Development | 3.23B | 3.10B | 2.77B | 2.49B | 2.23B | 2.05B | 2.02B | 1.77B | 1.54B | 1.45B | 1.43B | 1.32B | 1.24B | 1.12B | 1.14B | 934.12M | 1.10B | 1.14B | 1.15B | 940.51M | 991.87M | 920.62M | 1.05B | 1.20B | 1.11B | 681.80M | 643.90M | 567.60M | 481.40M | 329.70M | 189.10M | 0.00 | 0.00 | 0.00 | 0.00 | 0.00 | 0.00 | 0.00 | 0.00 | 0.00 |
| General & Administrative | 961.00M | 852.00M | 735.00M | 620.00M | 567.00M | 461.00M | 481.00M | 434.00M | 390.00M | 469.00M | 467.00M | 465.00M | 514.00M | 0.00 | 535.82M | 406.95M | 0.00 | 0.00 | 0.00 | 0.00 | 0.00 | 0.00 | 0.00 | 0.00 | 0.00 | 0.00 | 0.00 | 0.00 | 0.00 | 0.00 | 0.00 | 0.00 | 0.00 | 0.00 | 0.00 | 0.00 | 0.00 | 0.00 | 0.00 | 0.00 |
| Selling & Marketing | 836.00M | 776.00M | 703.00M | 609.00M | 526.00M | 521.00M | 521.00M | 456.00M | 429.00M | 428.00M | 423.00M | 433.00M | 481.00M | 0.00 | 406.03M | 327.57M | 0.00 | 0.00 | 0.00 | 0.00 | 0.00 | 0.00 | 0.00 | 0.00 | 0.00 | 0.00 | 0.00 | 0.00 | 0.00 | 0.00 | 0.00 | 0.00 | 0.00 | 0.00 | 0.00 | 0.00 | 0.00 | 0.00 | 0.00 | 0.00 |
| SG&A | 1.80B | 1.63B | 1.44B | 1.23B | 1.09B | 982.00M | 1.00B | 890.00M | 819.00M | 897.00M | 890.00M | 898.00M | 1.08B | 901.00M | 941.85M | 734.52M | 965.16M | 952.44M | 906.74M | 697.40M | 751.62M | 625.87M | 708.96M | 901.92M | 960.75M | 658.00M | 593.70M | 566.60M | 539.70M | 386.20M | 242.00M | 311.80M | 235.60M | 215.90M | 206.20M | 161.20M | 100.10M | 69.30M | 56.40M | 64.30M |
| Other Expenses | 0.00 | 0.00 | 0.00 | 311.00M | 0.00 | 0.00 | 0.00 | 0.00 | 0.00 | 0.00 | 0.00 | 0.00 | 0.00 | 0.00 | 0.00 | 0.00 | 0.00 | 0.00 | 572.66M | 0.00 | 26.63M | 0.00 | 85.48M | 221.16M | 0.00 | 48.30M | 237.20M | 16.30M | 0.00 | 0.00 | 0.00 | 38.90M | 28.90M | 24.50M | 16.00M | 11.70M | 11.40M | 9.30M | 7.80M | 5.20M |
| Operating Expenses | 5.03B | 4.73B | 4.21B | 3.71B | 3.33B | 3.04B | 3.02B | 2.66B | 2.36B | 2.35B | 2.32B | 2.22B | 2.31B | 1.99B | 2.09B | 1.67B | 2.07B | 2.09B | 2.63B | 1.64B | 1.77B | 1.55B | 1.85B | 2.32B | 1.91B | 1.39B | 1.47B | 1.15B | 1.02B | 715.90M | 429.10M | 350.70M | 264.50M | 240.40M | 222.20M | 172.90M | 111.50M | 78.60M | 64.20M | 69.50M |
| Cost & Expenses | 19.31B | 18.86B | 18.00B | 15.86B | 12.84B | 11.26B | 12.46B | 10.67B | 8.67B | 8.06B | 7.55B | 6.74B | 7.72B | 8.15B | 7.92B | 5.25B | 6.76B | 7.34B | 7.51B | 5.54B | 6.08B | 4.42B | 4.85B | 6.41B | 6.62B | 3.93B | 3.65B | 3.32B | 3.22B | 2.37B | 1.32B | 916.20M | 678.80M | 585.90M | 508.20M | 418.30M | 292.20M | 172.40M | 145.30M | 158.50M |
| Interest Income | 0.00 | 300.00M | 39.00M | 118.00M | 41.00M | 156.00M | 132.00M | 61.00M | 16.00M | 8.00M | 23.00M | 19.00M | 17.00M | 42.00M | 37.43M | 48.58M | 109.32M | 136.15M | 0.00 | 0.00 | 0.00 | 0.00 | 0.00 | 0.00 | 0.00 | 0.00 | 0.00 | 0.00 | 0.00 | 0.00 | 0.00 | 0.00 | 0.00 | 0.00 | 0.00 | 0.00 | 0.00 | 0.00 | 0.00 | 0.00 |
| Interest Expense | 247.00M | 238.00M | 228.00M | 236.00M | 240.00M | 237.00M | 234.00M | 198.00M | 155.00M | 103.00M | 95.00M | 95.00M | 95.00M | 59.00M | 21.51M | 21.30M | 20.51M | 38.63M | 0.00 | 0.00 | 0.00 | 0.00 | 0.00 | 0.00 | 0.00 | 0.00 | 0.00 | 0.00 | 0.00 | 0.00 | 0.00 | 0.00 | 0.00 | 0.00 | 0.00 | 0.00 | 0.00 | 0.00 | 0.00 | 0.00 |
| Depreciation & Amortization | 392.00M | 515.00M | 444.00M | 394.00M | 376.00M | 363.00M | 457.00M | 407.00M | 389.00M | 371.00M | 375.00M | 410.00M | 422.00M | 246.00M | 304.52M | 291.20M | 320.05M | 268.33M | 270.41M | 300.58M | 356.99M | 384.39M | 387.53M | 386.97M | 361.97M | 275.40M | 284.50M | 219.40M | 148.90M | 83.20M | 59.10M | 38.90M | 28.90M | 24.50M | 16.00M | 11.70M | 11.40M | 9.30M | 7.80M | 5.20M |
| EBITDA | 8.26B | 8.17B | 8.23B | 7.59B | 4.84B | 3.74B | 4.95B | 4.34B | 2.54B | 2.07B | 1.94B | 1.19B | 1.52B | 2.68B | 1.71B | -173.30M | 1.75B | 2.75B | 2.47B | 1.75B | 2.29B | 442.36M | 682.96M | 1.32B | 3.31B | 1.27B | 986.21M | 969.80M | 1.08B | 777.20M | 398.30M | 202.70M | 101.50M | 77.20M | 74.90M | 95.20M | 82.00M | 11.30M | 11.80M | 21.30M |
| EBITDA Ratio | 28.95% | 30.81% | 32.06% | 33.44% | 27.80% | 26.49% | 31.21% | 29.83% | 23.62% | 20.53% | 21.20% | 16.01% | 16.50% | 25.25% | 20.65% | -2.03% | 21.06% | 27.66% | 23.37% | 25.01% | 30.98% | 18.18% | 13.49% | 20.95% | 34.31% | 24.57% | 22.15% | 23.97% | 26.60% | 25.38% | 23.87% | 18.70% | 13.31% | 11.84% | 12.87% | 18.79% | 22.77% | 5.45% | 9.11% | 12.20% |
| Operating Income | 7.87B | 7.65B | 7.79B | 6.89B | 4.37B | 3.35B | 4.80B | 3.87B | 2.15B | 1.69B | 1.52B | 432.00M | 411.00M | 2.40B | 1.38B | -393.62M | 1.33B | 2.37B | 1.45B | 1.45B | 1.76B | -313.78M | 209.96M | 930.15M | 2.95B | 933.70M | 388.40M | 690.90M | 903.60M | 693.90M | 339.20M | 163.80M | 72.60M | 52.70M | 58.90M | 83.50M | 70.60M | 2.00M | 4.00M | 16.10M |
| Operating Income Ratio | 28.95% | 28.86% | 30.20% | 29.87% | 25.37% | 22.93% | 27.80% | 26.61% | 19.88% | 17.53% | 16.75% | 5.75% | 4.71% | 22.80% | 14.49% | -7.85% | 16.40% | 24.36% | 15.80% | 20.71% | 22.01% | -7.01% | 4.15% | 12.67% | 30.82% | 19.22% | 9.61% | 16.96% | 21.80% | 22.66% | 20.44% | 15.17% | 9.66% | 8.25% | 10.39% | 16.64% | 19.46% | 1.15% | 2.68% | 9.22% |
| Total Other Income/Expenses | 285.00M | 62.00M | -189.00M | -118.00M | -199.00M | -81.00M | -95.00M | -205.00M | -139.00M | -95.00M | -72.00M | -82.00M | -778.00M | -20.00M | 2.97M | -275.34M | 53.29M | -19.27M | 719.01M | 133.60M | -128.50M | 102.23M | 130.55M | 173.66M | 0.00 | 89.64M | -221.09M | 108.00M | -6.10M | 4.60M | -4.70M | -13.40M | -13.70M | -12.40M | -4.80M | 900.00K | -3.90M | -1.50M | -1.90M | -100.00K |
| Income Before Tax | 8.15B | 7.72B | 7.60B | 6.77B | 4.17B | 3.27B | 4.69B | 3.73B | 2.01B | 1.60B | 1.45B | 350.00M | 316.00M | 2.38B | 1.39B | -485.80M | 1.41B | 2.44B | 2.17B | 1.58B | 1.83B | -211.56M | 340.51M | 1.10B | 2.95B | 1.02B | 437.80M | 798.90M | 599.60M | 698.50M | 334.50M | 150.40M | 58.90M | 40.30M | 54.10M | 84.40M | 66.70M | 500.00K | 2.10M | 16.00M |
| Income Before Tax Ratio | 30.00% | 29.10% | 29.47% | 29.36% | 24.22% | 22.38% | 27.21% | 25.67% | 18.60% | 16.54% | 15.96% | 4.66% | 3.62% | 22.61% | 14.53% | -9.69% | 17.33% | 25.06% | 23.64% | 22.62% | 22.83% | -4.73% | 6.73% | 15.03% | 30.82% | 21.03% | 10.83% | 19.61% | 14.47% | 22.81% | 20.15% | 13.93% | 7.84% | 6.31% | 9.54% | 16.82% | 18.38% | 0.29% | 1.41% | 9.16% |
| Income Tax Expense | 975.00M | 860.00M | 1.07B | 883.00M | 547.00M | 563.00M | 1.38B | 297.00M | 292.00M | 221.00M | 342.00M | 94.00M | 207.00M | 452.00M | 449.10M | -180.48M | 447.97M | 729.46M | 650.31M | 371.67M | 477.95M | -62.41M | 71.51M | 328.57M | 884.29M | 329.90M | 148.90M | 300.40M | 322.90M | 244.50M | 117.10M | 50.70M | 19.40M | 14.10M | 20.00M | 32.90M | 26.70M | 200.00K | 900.00K | 6.70M |
| Net Income | 7.18B | 6.86B | 6.53B | 5.89B | 3.62B | 2.71B | 3.31B | 3.43B | 1.72B | 1.38B | 1.11B | 256.00M | 109.00M | 1.93B | 937.87M | -305.33M | 960.75M | 1.71B | 1.52B | 1.21B | 1.35B | -149.15M | 269.00M | 775.23M | 2.06B | 746.70M | 230.90M | 498.50M | 599.60M | 454.10M | 220.70M | 99.70M | 39.50M | 26.20M | 34.10M | 51.50M | 40.00M | 300.00K | 1.20M | 9.30M |
| Net Income Ratio | 26.41% | 25.86% | 25.31% | 25.53% | 21.04% | 18.52% | 19.20% | 23.62% | 15.90% | 14.26% | 12.19% | 3.41% | 1.25% | 18.31% | 9.82% | -6.09% | 11.82% | 17.57% | 16.54% | 17.30% | 16.86% | -3.33% | 5.31% | 10.56% | 21.58% | 15.37% | 5.71% | 12.24% | 14.47% | 14.83% | 13.30% | 9.23% | 5.26% | 4.10% | 6.01% | 10.26% | 11.03% | 0.17% | 0.80% | 5.33% |
| EPS | 8.68 | 8.16 | 7.49 | 6.47 | 3.95 | 2.89 | 3.27 | 3.20 | 1.56 | 1.13 | 0.91 | 0.21 | 0.09 | 1.46 | 0.70 | -0.23 | 0.71 | 1.22 | 0.98 | 0.75 | 0.80 | -0.09 | 0.16 | 0.31 | 1.28 | 0.48 | 0.16 | 0.33 | 0.42 | 0.32 | 0.17 | 0.08 | 0.04 | 0.03 | 0.04 | 0.05 | 0.04 | 0.01 | 0.01 | 0.02 |
| EPS Diluted | 8.61 | 8.11 | 7.44 | 6.41 | 3.92 | 2.86 | 3.23 | 3.17 | 1.54 | 1.12 | 0.90 | 0.21 | 0.09 | 1.45 | 0.70 | -0.23 | 0.70 | 1.20 | 0.97 | 0.73 | 0.78 | -0.09 | 0.16 | 0.30 | 1.20 | 0.46 | 0.15 | 0.33 | 0.41 | 0.32 | 0.17 | 0.08 | 0.04 | 0.03 | 0.04 | 0.05 | 0.04 | 0.01 | 0.01 | 0.02 |
| Weighted Avg Shares Out | 827.00M | 840.00M | 871.00M | 910.00M | 916.00M | 937.00M | 1.01B | 1.07B | 1.11B | 1.21B | 1.22B | 1.20B | 1.27B | 1.32B | 1.34B | 1.33B | 1.35B | 1.41B | 1.55B | 1.65B | 1.69B | 1.66B | 1.64B | 1.63B | 1.61B | 1.56B | 1.47B | 3.02B | 1.43B | 2.84B | 1.36B | 1.25B | 1.13B | 1.05B | 974.29M | 1.03B | 1.00B | 990.27M | 840.45M | 620.00M |
| Weighted Avg Shares Out (Dil) | 834.00M | 845.00M | 877.00M | 919.00M | 923.00M | 945.00M | 1.03B | 1.08B | 1.12B | 1.23B | 1.23B | 1.22B | 1.28B | 1.33B | 1.35B | 1.33B | 1.37B | 1.43B | 1.57B | 1.66B | 1.72B | 1.66B | 1.70B | 1.69B | 1.72B | 1.64B | 1.51B | 3.02B | 1.46B | 2.84B | 1.36B | 1.25B | 1.13B | 1.05B | 974.29M | 1.03B | 1.00B | 990.27M | 840.45M | 620.00M |
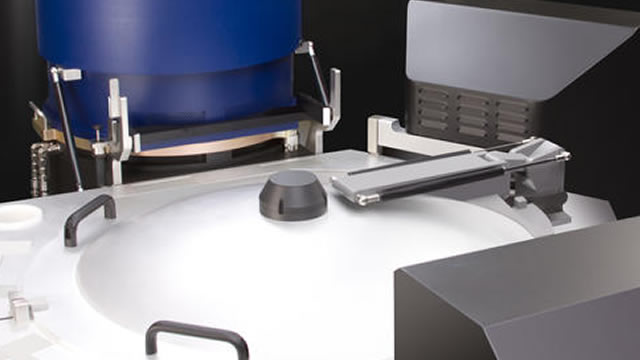
AMAT Q4 Earnings Beat: Will Dim Sales Guidance Pull the Stock Down?
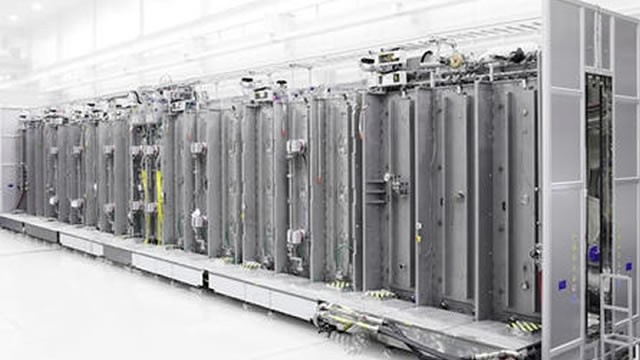
Applied Materials Stock Falls After Earnings

These Analysts Slash Their Forecasts On Applied Materials Following Q4 Earnings

Applied Materials Reports Q1 Results, Joins Oklo, AST SpaceMobile And Other Big Stocks Moving Lower In Friday's Pre-Market Session

Applied Materials, Inc. (AMAT) Q4 2024 Earnings Call Transcript
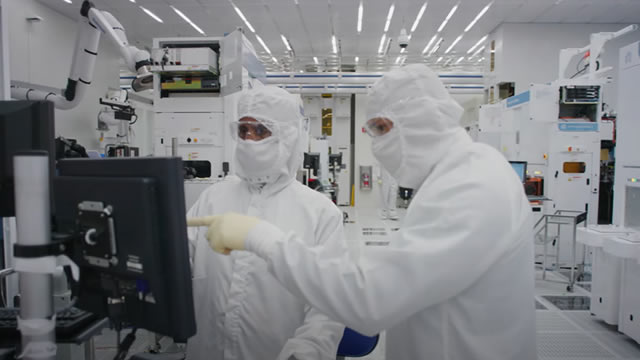
Applied Materials (AMAT) Reports Q4 Earnings: What Key Metrics Have to Say
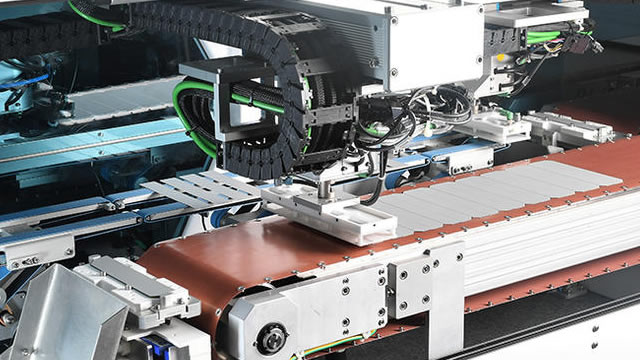
Applied Materials (AMAT) Tops Q4 Earnings and Revenue Estimates
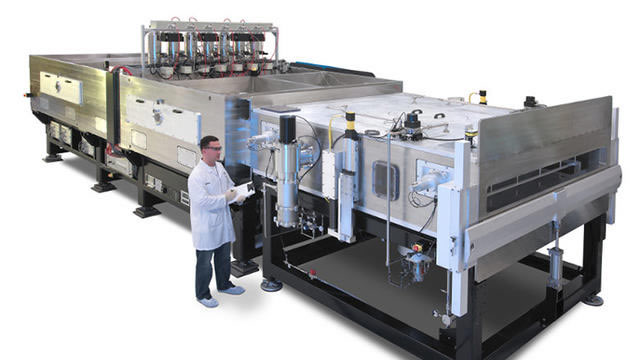
Everything is pointing green for Applied Materials, says Morningstar's William Kerwin

SHAREHOLDER ALERT: Pomerantz Law Firm Investigates Claims On Behalf of Investors of Applied Materials, Inc. - AMAT
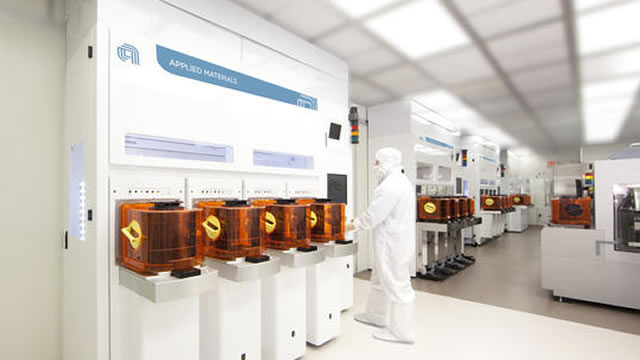
Applied Materials Stock Slides as Earnings Miss Expectations, China Sales Decline
Source: https://incomestatements.info
Category: Stock Reports
