See more : Realord Group Holdings Limited (1196.HK) Income Statement Analysis – Financial Results
Complete financial analysis of Applied Materials, Inc. (AMAT) income statement, including revenue, profit margins, EPS and key performance metrics. Get detailed insights into the financial performance of Applied Materials, Inc., a leading company in the Semiconductors industry within the Technology sector.
- Incitec Pivot Limited (IPL.AX) Income Statement Analysis – Financial Results
- QMC Quantum Minerals Corp (QMCQF) Income Statement Analysis – Financial Results
- Fabryki Sprzetu i Narzedzi Górniczych Grupa Kapitalowa FASING S.A. (FSG.WA) Income Statement Analysis – Financial Results
- Yamada Servicer Synthetic Office Co.,Ltd (4351.T) Income Statement Analysis – Financial Results
- Mobile Internet (China) Holdings Limited (1439.HK) Income Statement Analysis – Financial Results
Applied Materials, Inc. (AMAT)
About Applied Materials, Inc.
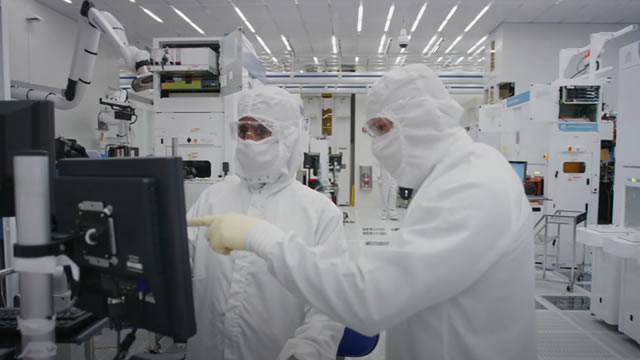
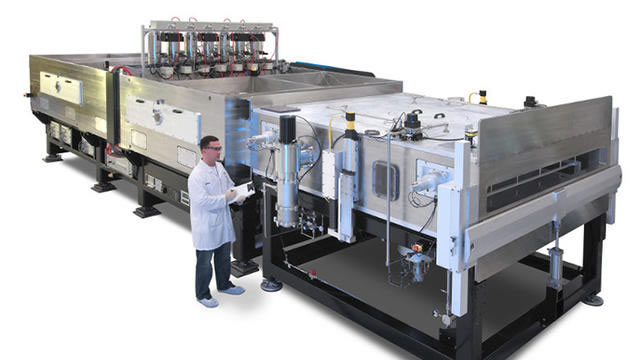
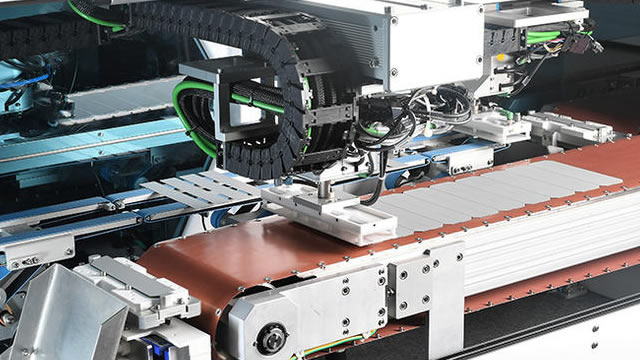
Applied Materials, Inc. provides manufacturing equipment, services, and software to the semiconductor, display, and related industries. It operates through three segments: Semiconductor Systems, Applied Global Services, and Display and Adjacent Markets. The Semiconductor Systems segment develops, manufactures, and sells various manufacturing equipment that is used to fabricate semiconductor chips or integrated circuits. This segment also offers various technologies, including epitaxy, ion implantation, oxidation/nitridation, rapid thermal processing, physical vapor deposition, chemical vapor deposition, chemical mechanical planarization, electrochemical deposition, atomic layer deposition, etching, and selective deposition and removal, as well as metrology and inspection tools. The Applied Global Services segment provides integrated solutions to optimize equipment and fab performance and productivity comprising spares, upgrades, services, remanufactured earlier generation equipment, and factory automation software for semiconductor, display, and other products. The Display and Adjacent Markets segment offers products for manufacturing liquid crystal displays; organic light-emitting diodes; and other display technologies for TVs, monitors, laptops, personal computers, electronic tablets, smart phones, and other consumer-oriented devices. The company operates in the United States, China, Korea, Taiwan, Japan, Southeast Asia, and Europe. Applied Materials, Inc. was incorporated in 1967 and is headquartered in Santa Clara, California.
| Metric | 2024 | 2023 | 2022 | 2021 | 2020 | 2019 | 2018 | 2017 | 2016 | 2015 | 2014 | 2013 | 2012 | 2011 | 2010 | 2009 | 2008 | 2007 | 2006 | 2005 | 2004 | 2003 | 2002 | 2001 | 2000 | 1999 | 1998 | 1997 | 1996 | 1995 | 1994 | 1993 | 1992 | 1991 | 1990 | 1989 | 1988 | 1987 | 1986 | 1985 |
|---|---|---|---|---|---|---|---|---|---|---|---|---|---|---|---|---|---|---|---|---|---|---|---|---|---|---|---|---|---|---|---|---|---|---|---|---|---|---|---|---|
| Revenue | 27.18B | 26.52B | 25.79B | 23.06B | 17.20B | 14.61B | 17.25B | 14.54B | 10.83B | 9.66B | 9.07B | 7.51B | 8.72B | 10.52B | 9.55B | 5.01B | 8.13B | 9.73B | 9.17B | 6.99B | 8.01B | 4.48B | 5.06B | 7.34B | 9.56B | 4.86B | 4.04B | 4.07B | 4.14B | 3.06B | 1.66B | 1.08B | 751.40M | 638.60M | 567.10M | 501.80M | 362.80M | 174.40M | 149.30M | 174.60M |
| Cost of Revenue | 14.28B | 14.13B | 13.79B | 12.15B | 9.51B | 8.22B | 9.44B | 8.01B | 6.31B | 5.71B | 5.23B | 4.52B | 5.41B | 6.16B | 5.83B | 3.58B | 4.69B | 5.24B | 4.88B | 3.91B | 4.31B | 2.87B | 3.01B | 4.09B | 4.71B | 2.54B | 2.18B | 2.17B | 2.20B | 1.65B | 891.50M | 565.50M | 414.30M | 345.50M | 286.00M | 245.40M | 180.70M | 93.80M | 81.10M | 89.00M |
| Gross Profit | 12.90B | 12.38B | 11.99B | 10.91B | 7.69B | 6.39B | 7.82B | 6.53B | 4.51B | 3.95B | 3.84B | 2.99B | 3.31B | 4.36B | 3.72B | 1.43B | 3.44B | 4.49B | 4.29B | 3.09B | 3.70B | 1.60B | 2.06B | 3.25B | 4.86B | 2.32B | 1.86B | 1.90B | 1.95B | 1.41B | 768.30M | 514.50M | 337.10M | 293.10M | 281.10M | 256.40M | 182.10M | 80.60M | 68.20M | 85.60M |
| Gross Profit Ratio | 47.46% | 46.70% | 46.51% | 47.32% | 44.72% | 43.72% | 45.31% | 44.93% | 41.67% | 40.92% | 42.36% | 39.83% | 38.00% | 41.46% | 38.91% | 28.54% | 42.35% | 46.15% | 46.82% | 44.14% | 46.19% | 35.84% | 40.63% | 44.29% | 50.77% | 47.78% | 46.10% | 46.66% | 47.04% | 46.05% | 46.29% | 47.64% | 44.86% | 45.90% | 49.57% | 51.10% | 50.19% | 46.22% | 45.68% | 49.03% |
| Research & Development | 3.23B | 3.10B | 2.77B | 2.49B | 2.23B | 2.05B | 2.02B | 1.77B | 1.54B | 1.45B | 1.43B | 1.32B | 1.24B | 1.12B | 1.14B | 934.12M | 1.10B | 1.14B | 1.15B | 940.51M | 991.87M | 920.62M | 1.05B | 1.20B | 1.11B | 681.80M | 643.90M | 567.60M | 481.40M | 329.70M | 189.10M | 0.00 | 0.00 | 0.00 | 0.00 | 0.00 | 0.00 | 0.00 | 0.00 | 0.00 |
| General & Administrative | 961.00M | 852.00M | 735.00M | 620.00M | 567.00M | 461.00M | 481.00M | 434.00M | 390.00M | 469.00M | 467.00M | 465.00M | 514.00M | 0.00 | 535.82M | 406.95M | 0.00 | 0.00 | 0.00 | 0.00 | 0.00 | 0.00 | 0.00 | 0.00 | 0.00 | 0.00 | 0.00 | 0.00 | 0.00 | 0.00 | 0.00 | 0.00 | 0.00 | 0.00 | 0.00 | 0.00 | 0.00 | 0.00 | 0.00 | 0.00 |
| Selling & Marketing | 836.00M | 776.00M | 703.00M | 609.00M | 526.00M | 521.00M | 521.00M | 456.00M | 429.00M | 428.00M | 423.00M | 433.00M | 481.00M | 0.00 | 406.03M | 327.57M | 0.00 | 0.00 | 0.00 | 0.00 | 0.00 | 0.00 | 0.00 | 0.00 | 0.00 | 0.00 | 0.00 | 0.00 | 0.00 | 0.00 | 0.00 | 0.00 | 0.00 | 0.00 | 0.00 | 0.00 | 0.00 | 0.00 | 0.00 | 0.00 |
| SG&A | 1.80B | 1.63B | 1.44B | 1.23B | 1.09B | 982.00M | 1.00B | 890.00M | 819.00M | 897.00M | 890.00M | 898.00M | 1.08B | 901.00M | 941.85M | 734.52M | 965.16M | 952.44M | 906.74M | 697.40M | 751.62M | 625.87M | 708.96M | 901.92M | 960.75M | 658.00M | 593.70M | 566.60M | 539.70M | 386.20M | 242.00M | 311.80M | 235.60M | 215.90M | 206.20M | 161.20M | 100.10M | 69.30M | 56.40M | 64.30M |
| Other Expenses | 0.00 | 0.00 | 0.00 | 311.00M | 0.00 | 0.00 | 0.00 | 0.00 | 0.00 | 0.00 | 0.00 | 0.00 | 0.00 | 0.00 | 0.00 | 0.00 | 0.00 | 0.00 | 572.66M | 0.00 | 26.63M | 0.00 | 85.48M | 221.16M | 0.00 | 48.30M | 237.20M | 16.30M | 0.00 | 0.00 | 0.00 | 38.90M | 28.90M | 24.50M | 16.00M | 11.70M | 11.40M | 9.30M | 7.80M | 5.20M |
| Operating Expenses | 5.03B | 4.73B | 4.21B | 3.71B | 3.33B | 3.04B | 3.02B | 2.66B | 2.36B | 2.35B | 2.32B | 2.22B | 2.31B | 1.99B | 2.09B | 1.67B | 2.07B | 2.09B | 2.63B | 1.64B | 1.77B | 1.55B | 1.85B | 2.32B | 1.91B | 1.39B | 1.47B | 1.15B | 1.02B | 715.90M | 429.10M | 350.70M | 264.50M | 240.40M | 222.20M | 172.90M | 111.50M | 78.60M | 64.20M | 69.50M |
| Cost & Expenses | 19.31B | 18.86B | 18.00B | 15.86B | 12.84B | 11.26B | 12.46B | 10.67B | 8.67B | 8.06B | 7.55B | 6.74B | 7.72B | 8.15B | 7.92B | 5.25B | 6.76B | 7.34B | 7.51B | 5.54B | 6.08B | 4.42B | 4.85B | 6.41B | 6.62B | 3.93B | 3.65B | 3.32B | 3.22B | 2.37B | 1.32B | 916.20M | 678.80M | 585.90M | 508.20M | 418.30M | 292.20M | 172.40M | 145.30M | 158.50M |
| Interest Income | 0.00 | 300.00M | 39.00M | 118.00M | 41.00M | 156.00M | 132.00M | 61.00M | 16.00M | 8.00M | 23.00M | 19.00M | 17.00M | 42.00M | 37.43M | 48.58M | 109.32M | 136.15M | 0.00 | 0.00 | 0.00 | 0.00 | 0.00 | 0.00 | 0.00 | 0.00 | 0.00 | 0.00 | 0.00 | 0.00 | 0.00 | 0.00 | 0.00 | 0.00 | 0.00 | 0.00 | 0.00 | 0.00 | 0.00 | 0.00 |
| Interest Expense | 247.00M | 238.00M | 228.00M | 236.00M | 240.00M | 237.00M | 234.00M | 198.00M | 155.00M | 103.00M | 95.00M | 95.00M | 95.00M | 59.00M | 21.51M | 21.30M | 20.51M | 38.63M | 0.00 | 0.00 | 0.00 | 0.00 | 0.00 | 0.00 | 0.00 | 0.00 | 0.00 | 0.00 | 0.00 | 0.00 | 0.00 | 0.00 | 0.00 | 0.00 | 0.00 | 0.00 | 0.00 | 0.00 | 0.00 | 0.00 |
| Depreciation & Amortization | 392.00M | 515.00M | 444.00M | 394.00M | 376.00M | 363.00M | 457.00M | 407.00M | 389.00M | 371.00M | 375.00M | 410.00M | 422.00M | 246.00M | 304.52M | 291.20M | 320.05M | 268.33M | 270.41M | 300.58M | 356.99M | 384.39M | 387.53M | 386.97M | 361.97M | 275.40M | 284.50M | 219.40M | 148.90M | 83.20M | 59.10M | 38.90M | 28.90M | 24.50M | 16.00M | 11.70M | 11.40M | 9.30M | 7.80M | 5.20M |
| EBITDA | 8.26B | 8.17B | 8.23B | 7.59B | 4.84B | 3.74B | 4.95B | 4.34B | 2.54B | 2.07B | 1.94B | 1.19B | 1.52B | 2.68B | 1.71B | -173.30M | 1.75B | 2.75B | 2.47B | 1.75B | 2.29B | 442.36M | 682.96M | 1.32B | 3.31B | 1.27B | 986.21M | 969.80M | 1.08B | 777.20M | 398.30M | 202.70M | 101.50M | 77.20M | 74.90M | 95.20M | 82.00M | 11.30M | 11.80M | 21.30M |
| EBITDA Ratio | 28.95% | 30.81% | 32.06% | 33.44% | 27.80% | 26.49% | 31.21% | 29.83% | 23.62% | 20.53% | 21.20% | 16.01% | 16.50% | 25.25% | 20.65% | -2.03% | 21.06% | 27.66% | 23.37% | 25.01% | 30.98% | 18.18% | 13.49% | 20.95% | 34.31% | 24.57% | 22.15% | 23.97% | 26.60% | 25.38% | 23.87% | 18.70% | 13.31% | 11.84% | 12.87% | 18.79% | 22.77% | 5.45% | 9.11% | 12.20% |
| Operating Income | 7.87B | 7.65B | 7.79B | 6.89B | 4.37B | 3.35B | 4.80B | 3.87B | 2.15B | 1.69B | 1.52B | 432.00M | 411.00M | 2.40B | 1.38B | -393.62M | 1.33B | 2.37B | 1.45B | 1.45B | 1.76B | -313.78M | 209.96M | 930.15M | 2.95B | 933.70M | 388.40M | 690.90M | 903.60M | 693.90M | 339.20M | 163.80M | 72.60M | 52.70M | 58.90M | 83.50M | 70.60M | 2.00M | 4.00M | 16.10M |
| Operating Income Ratio | 28.95% | 28.86% | 30.20% | 29.87% | 25.37% | 22.93% | 27.80% | 26.61% | 19.88% | 17.53% | 16.75% | 5.75% | 4.71% | 22.80% | 14.49% | -7.85% | 16.40% | 24.36% | 15.80% | 20.71% | 22.01% | -7.01% | 4.15% | 12.67% | 30.82% | 19.22% | 9.61% | 16.96% | 21.80% | 22.66% | 20.44% | 15.17% | 9.66% | 8.25% | 10.39% | 16.64% | 19.46% | 1.15% | 2.68% | 9.22% |
| Total Other Income/Expenses | 285.00M | 62.00M | -189.00M | -118.00M | -199.00M | -81.00M | -95.00M | -205.00M | -139.00M | -95.00M | -72.00M | -82.00M | -778.00M | -20.00M | 2.97M | -275.34M | 53.29M | -19.27M | 719.01M | 133.60M | -128.50M | 102.23M | 130.55M | 173.66M | 0.00 | 89.64M | -221.09M | 108.00M | -6.10M | 4.60M | -4.70M | -13.40M | -13.70M | -12.40M | -4.80M | 900.00K | -3.90M | -1.50M | -1.90M | -100.00K |
| Income Before Tax | 8.15B | 7.72B | 7.60B | 6.77B | 4.17B | 3.27B | 4.69B | 3.73B | 2.01B | 1.60B | 1.45B | 350.00M | 316.00M | 2.38B | 1.39B | -485.80M | 1.41B | 2.44B | 2.17B | 1.58B | 1.83B | -211.56M | 340.51M | 1.10B | 2.95B | 1.02B | 437.80M | 798.90M | 599.60M | 698.50M | 334.50M | 150.40M | 58.90M | 40.30M | 54.10M | 84.40M | 66.70M | 500.00K | 2.10M | 16.00M |
| Income Before Tax Ratio | 30.00% | 29.10% | 29.47% | 29.36% | 24.22% | 22.38% | 27.21% | 25.67% | 18.60% | 16.54% | 15.96% | 4.66% | 3.62% | 22.61% | 14.53% | -9.69% | 17.33% | 25.06% | 23.64% | 22.62% | 22.83% | -4.73% | 6.73% | 15.03% | 30.82% | 21.03% | 10.83% | 19.61% | 14.47% | 22.81% | 20.15% | 13.93% | 7.84% | 6.31% | 9.54% | 16.82% | 18.38% | 0.29% | 1.41% | 9.16% |
| Income Tax Expense | 975.00M | 860.00M | 1.07B | 883.00M | 547.00M | 563.00M | 1.38B | 297.00M | 292.00M | 221.00M | 342.00M | 94.00M | 207.00M | 452.00M | 449.10M | -180.48M | 447.97M | 729.46M | 650.31M | 371.67M | 477.95M | -62.41M | 71.51M | 328.57M | 884.29M | 329.90M | 148.90M | 300.40M | 322.90M | 244.50M | 117.10M | 50.70M | 19.40M | 14.10M | 20.00M | 32.90M | 26.70M | 200.00K | 900.00K | 6.70M |
| Net Income | 7.18B | 6.86B | 6.53B | 5.89B | 3.62B | 2.71B | 3.31B | 3.43B | 1.72B | 1.38B | 1.11B | 256.00M | 109.00M | 1.93B | 937.87M | -305.33M | 960.75M | 1.71B | 1.52B | 1.21B | 1.35B | -149.15M | 269.00M | 775.23M | 2.06B | 746.70M | 230.90M | 498.50M | 599.60M | 454.10M | 220.70M | 99.70M | 39.50M | 26.20M | 34.10M | 51.50M | 40.00M | 300.00K | 1.20M | 9.30M |
| Net Income Ratio | 26.41% | 25.86% | 25.31% | 25.53% | 21.04% | 18.52% | 19.20% | 23.62% | 15.90% | 14.26% | 12.19% | 3.41% | 1.25% | 18.31% | 9.82% | -6.09% | 11.82% | 17.57% | 16.54% | 17.30% | 16.86% | -3.33% | 5.31% | 10.56% | 21.58% | 15.37% | 5.71% | 12.24% | 14.47% | 14.83% | 13.30% | 9.23% | 5.26% | 4.10% | 6.01% | 10.26% | 11.03% | 0.17% | 0.80% | 5.33% |
| EPS | 8.68 | 8.16 | 7.49 | 6.47 | 3.95 | 2.89 | 3.27 | 3.20 | 1.56 | 1.13 | 0.91 | 0.21 | 0.09 | 1.46 | 0.70 | -0.23 | 0.71 | 1.22 | 0.98 | 0.75 | 0.80 | -0.09 | 0.16 | 0.31 | 1.28 | 0.48 | 0.16 | 0.33 | 0.42 | 0.32 | 0.17 | 0.08 | 0.04 | 0.03 | 0.04 | 0.05 | 0.04 | 0.01 | 0.01 | 0.02 |
| EPS Diluted | 8.61 | 8.11 | 7.44 | 6.41 | 3.92 | 2.86 | 3.23 | 3.17 | 1.54 | 1.12 | 0.90 | 0.21 | 0.09 | 1.45 | 0.70 | -0.23 | 0.70 | 1.20 | 0.97 | 0.73 | 0.78 | -0.09 | 0.16 | 0.30 | 1.20 | 0.46 | 0.15 | 0.33 | 0.41 | 0.32 | 0.17 | 0.08 | 0.04 | 0.03 | 0.04 | 0.05 | 0.04 | 0.01 | 0.01 | 0.02 |
| Weighted Avg Shares Out | 827.00M | 840.00M | 871.00M | 910.00M | 916.00M | 937.00M | 1.01B | 1.07B | 1.11B | 1.21B | 1.22B | 1.20B | 1.27B | 1.32B | 1.34B | 1.33B | 1.35B | 1.41B | 1.55B | 1.65B | 1.69B | 1.66B | 1.64B | 1.63B | 1.61B | 1.56B | 1.47B | 3.02B | 1.43B | 2.84B | 1.36B | 1.25B | 1.13B | 1.05B | 974.29M | 1.03B | 1.00B | 990.27M | 840.45M | 620.00M |
| Weighted Avg Shares Out (Dil) | 834.00M | 845.00M | 877.00M | 919.00M | 923.00M | 945.00M | 1.03B | 1.08B | 1.12B | 1.23B | 1.23B | 1.22B | 1.28B | 1.33B | 1.35B | 1.33B | 1.37B | 1.43B | 1.57B | 1.66B | 1.72B | 1.66B | 1.70B | 1.69B | 1.72B | 1.64B | 1.51B | 3.02B | 1.46B | 2.84B | 1.36B | 1.25B | 1.13B | 1.05B | 974.29M | 1.03B | 1.00B | 990.27M | 840.45M | 620.00M |

SHAREHOLDER ALERT: Pomerantz Law Firm Investigates Claims On Behalf of Investors of Applied Materials, Inc. - AMAT

Wall Street Analysts Think Applied Materials (AMAT) Is a Good Investment: Is It?

AMAT Stock To Benefit From Higher AI Chip Demand?

SHAREHOLDER ALERT: Pomerantz Law Firm Investigates Claims On Behalf of Investors of Applied Materials, Inc. - AMAT

SHAREHOLDER ALERT: Pomerantz Law Firm Investigates Claims On Behalf of Investors of Applied Materials, Inc. - AMAT

Applied Materials, Inc. (AMAT) is Attracting Investor Attention: Here is What You Should Know

SHAREHOLDER ALERT: Pomerantz Law Firm Investigates Claims On Behalf of Investors of Applied Materials, Inc. - AMAT

SHAREHOLDER ALERT: Pomerantz Law Firm Investigates Claims On Behalf of Investors of Applied Materials, Inc. - AMAT

Applied Materials (AMAT) Registers a Bigger Fall Than the Market: Important Facts to Note

Is Applied Materials Stock a Buy, Sell or Hold at a P/E of 19.29X?
Source: https://incomestatements.info
Category: Stock Reports
