See more : The Star Entertainment Group Limited (EHGRF) Income Statement Analysis – Financial Results
Complete financial analysis of Cleveland-Cliffs Inc. (CLF) income statement, including revenue, profit margins, EPS and key performance metrics. Get detailed insights into the financial performance of Cleveland-Cliffs Inc., a leading company in the Steel industry within the Basic Materials sector.
- PennyMac Mortgage Investment Trust (PMT-PB) Income Statement Analysis – Financial Results
- Nanjing Sinolife United Company Limited (3332.HK) Income Statement Analysis – Financial Results
- Gevo, Inc. (GEVO) Income Statement Analysis – Financial Results
- SOUTHERN FINANCIAL CORPORATION (SFCO) Income Statement Analysis – Financial Results
- Terme Bancorp, Inc. (TMEB) Income Statement Analysis – Financial Results
Cleveland-Cliffs Inc. (CLF)
About Cleveland-Cliffs Inc.
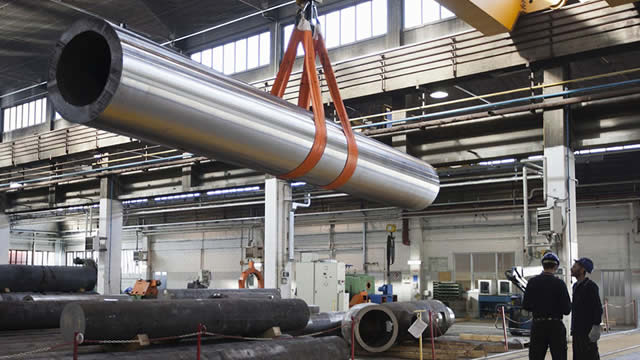
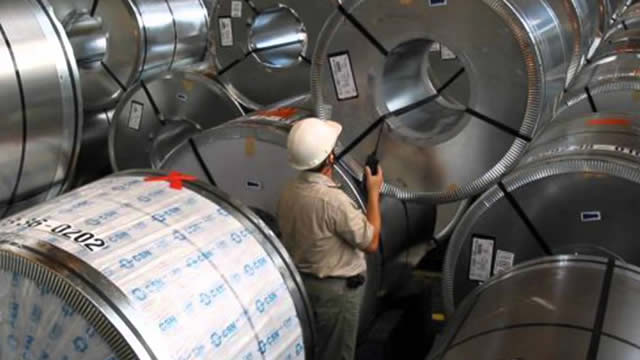
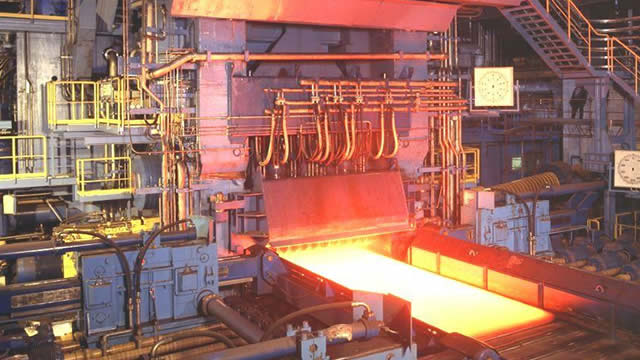
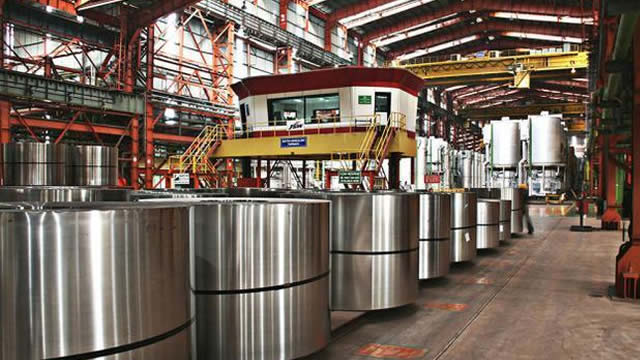
Cleveland-Cliffs Inc. operates as a flat-rolled steel producer in North America. The company offers carbon steel products, such as hot-rolled, cold-rolled, electrogalvanized, hot-dip galvanized, hot-dip galvannealed, aluminized, enameling, and advanced high-strength steel products; stainless steel products; plates; and grain oriented and non-oriented electrical steel products. It also provides tubular components, including carbon steel, stainless steel, and electric resistance welded tubing. In addition, the company offers tinplate products, such as electrolytic tin coated and chrome coated sheet, and tin mill products; tooling and sampling; raw materials; ingots, rolled blooms, and cast blooms; and hot-briquetted iron products. Further, it owns five iron ore mines in Minnesota and Michigan. The company serves automotive, infrastructure and manufacturing, distributors and converters, and steel producers. Cleveland-Cliffs Inc. was formerly known as Cliffs Natural Resources Inc. and changed its name to Cleveland-Cliffs Inc. in August 2017. The company was founded in 1847 and is headquartered in Cleveland, Ohio.
| Metric | 2023 | 2022 | 2021 | 2020 | 2019 | 2018 | 2017 | 2016 | 2015 | 2014 | 2013 | 2012 | 2011 | 2010 | 2009 | 2008 | 2007 | 2006 | 2005 | 2004 | 2003 | 2002 | 2001 | 2000 | 1999 | 1998 | 1997 | 1996 | 1995 | 1994 | 1993 | 1992 | 1991 | 1990 | 1989 | 1988 | 1987 | 1986 | 1985 |
|---|---|---|---|---|---|---|---|---|---|---|---|---|---|---|---|---|---|---|---|---|---|---|---|---|---|---|---|---|---|---|---|---|---|---|---|---|---|---|---|
| Revenue | 22.00B | 22.99B | 20.44B | 5.35B | 1.99B | 2.33B | 2.33B | 2.11B | 2.01B | 4.62B | 5.69B | 5.87B | 6.79B | 4.68B | 2.34B | 3.61B | 2.28B | 1.92B | 1.74B | 1.21B | 857.70M | 598.60M | 330.40M | 430.10M | 361.40M | 493.80M | 438.90M | 503.20M | 460.70M | 388.90M | 355.90M | 310.70M | 317.40M | 309.90M | 350.50M | 393.30M | 363.20M | 266.80M | 326.40M |
| Cost of Revenue | 20.61B | 20.47B | 15.91B | 5.10B | 1.41B | 1.52B | 1.82B | 1.72B | 1.78B | 4.17B | 4.54B | 4.70B | 4.11B | 3.16B | 2.03B | 2.45B | 1.81B | 1.51B | 1.35B | 1.06B | 835.00M | 582.70M | 401.80M | 354.60M | 296.50M | 377.70M | 335.60M | 375.30M | 339.60M | 285.50M | 239.30M | 227.00M | 239.30M | 249.90M | 224.90M | 279.00M | 329.20M | 283.70M | 273.00M |
| Gross Profit | 1.39B | 2.52B | 4.53B | 252.00M | 575.70M | 809.60M | 509.60M | 389.30M | 236.50M | 451.40M | 1.15B | 1.17B | 2.69B | 1.52B | 308.90M | 1.16B | 462.00M | 414.00M | 389.00M | 149.90M | 22.70M | 15.90M | -71.40M | 75.50M | 64.90M | 116.10M | 103.30M | 127.90M | 121.10M | 103.40M | 116.60M | 83.70M | 78.10M | 60.00M | 125.60M | 114.30M | 34.00M | -16.90M | 53.40M |
| Gross Profit Ratio | 6.32% | 10.95% | 22.18% | 4.71% | 28.93% | 34.71% | 21.87% | 18.46% | 11.75% | 9.76% | 20.19% | 19.96% | 39.57% | 32.54% | 13.19% | 32.13% | 20.31% | 21.54% | 22.36% | 12.42% | 2.65% | 2.66% | -21.61% | 17.55% | 17.96% | 23.51% | 23.54% | 25.42% | 26.29% | 26.59% | 32.76% | 26.94% | 24.61% | 19.36% | 35.83% | 29.06% | 9.36% | -6.33% | 16.36% |
| Research & Development | 0.00 | 0.00 | 0.00 | 0.00 | 0.00 | 0.00 | 0.00 | 0.00 | 0.00 | 0.00 | 0.00 | 0.00 | 0.00 | 0.00 | 0.00 | 0.00 | 0.00 | 0.00 | 0.00 | 0.00 | 0.00 | 0.00 | 0.00 | 0.00 | 0.00 | 0.00 | 0.00 | 0.00 | 0.00 | 0.00 | 0.00 | 0.00 | 0.00 | 0.00 | 0.00 | 0.00 | 0.00 | 0.00 | 0.00 |
| General & Administrative | 0.00 | 0.00 | 0.00 | 0.00 | 0.00 | 0.00 | 0.00 | 0.00 | 0.00 | 0.00 | 0.00 | 0.00 | 0.00 | 0.00 | 0.00 | 0.00 | 0.00 | 0.00 | 0.00 | 0.00 | 0.00 | 0.00 | 0.00 | 0.00 | 0.00 | 0.00 | 0.00 | 0.00 | 0.00 | 0.00 | 0.00 | 0.00 | 0.00 | 0.00 | 0.00 | 0.00 | 0.00 | 0.00 | 0.00 |
| Selling & Marketing | 0.00 | 0.00 | 0.00 | 0.00 | 0.00 | 0.00 | 0.00 | 0.00 | 0.00 | 0.00 | 0.00 | 0.00 | 0.00 | 0.00 | 0.00 | 0.00 | 0.00 | 0.00 | 0.00 | 0.00 | 0.00 | 0.00 | 0.00 | 0.00 | 0.00 | 0.00 | 0.00 | 0.00 | 0.00 | 0.00 | 0.00 | 0.00 | 0.00 | 0.00 | 0.00 | 0.00 | 0.00 | 0.00 | 0.00 |
| SG&A | 577.00M | 465.00M | 422.00M | 244.00M | 119.40M | 116.80M | 105.80M | 117.80M | 110.00M | 208.70M | 231.60M | 282.50M | 274.40M | 238.00M | -120.70M | 186.40M | 114.20M | 64.00M | 47.90M | 37.60M | 25.10M | 23.80M | 21.00M | 18.70M | 16.10M | 18.70M | 17.10M | 16.70M | 15.10M | 15.90M | 15.20M | 16.60M | 19.70M | 15.20M | 17.90M | 22.00M | 18.90M | 17.30M | 14.90M |
| Other Expenses | 137.00M | 110.00M | 80.00M | 60.00M | 27.00M | 17.20M | 3.20M | 400.00K | -2.60M | 26.80M | 900.00K | 2.70M | 80.50M | 20.50M | -42.00M | -47.40M | -30.60M | -11.70M | -1.10M | 141.40M | 32.80M | 67.90M | 0.00 | 25.60M | 22.50M | 20.30M | 18.90M | 17.60M | 16.80M | 14.40M | 13.50M | 14.10M | 16.00M | 14.60M | 15.00M | 20.30M | 2.70M | 17.20M | 18.10M |
| Operating Expenses | 714.00M | 575.00M | 502.00M | 304.00M | 146.40M | 136.40M | 78.10M | 148.50M | 81.90M | 443.80M | 227.50M | 431.00M | 354.90M | 258.50M | -78.70M | 220.80M | 83.60M | 52.30M | 46.80M | 179.00M | 25.10M | 23.80M | 21.00M | 44.30M | 38.60M | 39.00M | 36.00M | 34.30M | 31.90M | 30.30M | 28.70M | 30.70M | 35.70M | 29.80M | 32.90M | 42.30M | 21.60M | 34.50M | 33.00M |
| Cost & Expenses | 21.32B | 21.05B | 16.41B | 5.41B | 1.56B | 1.66B | 1.90B | 1.87B | 1.86B | 4.62B | 4.77B | 5.13B | 4.46B | 3.42B | 1.95B | 2.67B | 1.90B | 1.56B | 1.40B | 1.24B | 860.10M | 606.50M | 422.80M | 398.90M | 335.10M | 416.70M | 371.60M | 409.60M | 371.50M | 315.80M | 268.00M | 257.70M | 275.00M | 279.70M | 257.80M | 321.30M | 350.80M | 318.20M | 306.00M |
| Interest Income | 0.00 | 276.00M | 337.00M | 238.00M | 101.00M | 0.00 | 0.00 | 0.00 | 0.00 | 0.00 | 0.00 | 0.00 | 9.50M | 9.90M | 10.80M | 26.20M | 0.00 | 0.00 | 0.00 | 0.00 | 10.60M | 4.80M | 0.00 | 0.00 | 0.00 | 0.00 | 0.00 | 0.00 | 0.00 | 0.00 | 0.00 | 0.00 | 0.00 | 0.00 | 0.00 | 0.00 | 0.00 | 0.00 | 0.00 |
| Interest Expense | 289.00M | 276.00M | 337.00M | 238.00M | 101.20M | 118.90M | 132.00M | 200.50M | 228.50M | 185.20M | 179.10M | 195.60M | 216.50M | 69.70M | 39.00M | 39.80M | 0.00 | 0.00 | 0.00 | 0.00 | 4.60M | 6.60M | 0.00 | 0.00 | 0.00 | 0.00 | 0.00 | 0.00 | 0.00 | 0.00 | 0.00 | 0.00 | 0.00 | 0.00 | 0.00 | 0.00 | 0.00 | 0.00 | 0.00 |
| Depreciation & Amortization | 973.00M | 1.03B | 904.00M | 308.00M | 85.10M | 89.00M | 87.70M | 115.40M | 134.00M | 504.00M | 593.30M | 525.80M | 426.90M | 322.30M | 236.60M | 201.10M | 107.20M | 83.30M | 52.80M | 29.30M | 29.00M | 33.90M | 26.20M | 25.60M | 22.50M | 20.30M | 18.90M | 17.60M | 16.80M | 14.40M | 13.50M | 14.10M | 16.00M | 14.60M | 15.00M | 20.30M | 2.70M | 17.20M | 18.10M |
| EBITDA | 1.86B | 3.11B | 5.04B | 310.00M | 498.40M | 776.00M | 477.90M | 288.00M | 675.60M | -8.91B | 1.26B | 219.60M | 2.88B | 1.69B | 565.50M | 957.20M | 485.60M | 445.00M | 395.00M | 154.30M | -8.00M | 21.40M | 12.60M | 56.60M | 41.70M | 97.40M | 103.00M | 111.20M | 106.00M | 87.50M | 101.40M | 67.10M | 58.40M | 44.80M | 107.70M | 92.30M | 15.10M | -34.20M | 38.50M |
| EBITDA Ratio | 8.45% | 13.85% | 25.17% | 5.85% | 25.96% | 33.42% | 22.42% | 16.91% | 14.21% | 11.64% | 26.64% | 21.62% | 40.77% | 28.10% | 10.29% | 26.74% | 19.64% | 21.69% | 20.87% | -25.63% | 5.00% | 22.54% | -33.44% | 15.11% | 18.46% | 20.72% | 17.84% | 20.81% | 25.42% | 24.81% | 30.06% | 23.72% | 8.48% | -12.17% | 29.24% | 22.20% | -9.25% | -13.87% | 9.01% |
| Operating Income | 677.00M | 1.94B | 4.01B | 5.00M | 429.30M | 673.20M | 431.50M | 240.80M | 151.30M | -9.43B | 671.00M | -308.80M | 2.33B | 1.27B | 230.20M | 938.90M | 378.40M | 361.70M | 342.20M | -29.10M | -2.40M | -7.90M | -92.40M | 31.20M | 26.30M | 77.10M | 67.30M | 93.60M | 89.20M | 73.10M | 87.90M | 53.00M | 42.40M | 30.20M | 92.70M | 72.00M | 12.40M | -51.40M | 20.40M |
| Operating Income Ratio | 3.08% | 8.43% | 19.62% | 0.09% | 21.57% | 28.86% | 18.52% | 11.42% | 7.52% | -203.86% | 11.79% | -5.26% | 34.35% | 27.02% | 9.83% | 26.01% | 16.63% | 18.82% | 19.67% | -2.41% | -0.28% | -1.32% | -27.97% | 7.25% | 7.28% | 15.61% | 15.33% | 18.60% | 19.36% | 18.80% | 24.70% | 17.06% | 13.36% | 9.75% | 26.45% | 18.31% | 3.41% | -19.27% | 6.25% |
| Total Other Income/Expenses | -80.00M | -143.00M | -209.00M | -51.00M | -117.20M | -108.30M | -282.00M | 76.30M | 161.80M | -9.71B | -891.00M | -193.00M | -92.20M | 65.40M | 60.40M | -312.70M | 2.30M | 26.10M | 25.90M | 167.20M | 1.80M | -44.80M | -17.90M | -1.30M | -14.50M | -5.30M | 5.30M | 1.90M | -17.60M | -15.60M | -12.20M | -11.60M | 27.70M | 76.40M | -5.80M | -7.70M | 36.50M | -4.50M | 1.60M |
| Income Before Tax | 597.00M | 1.80B | 3.80B | -193.00M | 312.10M | 564.70M | 137.30M | 207.00M | 313.10M | -9.58B | 489.30M | -501.80M | 2.24B | 1.30B | 290.60M | 716.30M | 380.70M | 387.80M | 368.10M | 285.60M | -35.20M | -57.30M | -53.60M | 16.60M | 4.70M | 71.80M | 72.60M | 95.50M | 71.60M | 57.50M | 75.70M | 41.40M | 70.10M | 106.60M | 86.90M | 64.30M | 48.90M | -55.90M | 22.00M |
| Income Before Tax Ratio | 2.71% | 7.81% | 18.60% | -3.60% | 15.68% | 24.21% | 5.89% | 9.82% | 15.55% | -207.29% | 8.60% | -8.54% | 32.99% | 27.73% | 12.41% | 19.85% | 16.73% | 20.18% | 21.16% | 23.67% | -4.10% | -9.57% | -16.22% | 3.86% | 1.30% | 14.54% | 16.54% | 18.98% | 15.54% | 14.79% | 21.27% | 13.32% | 22.09% | 34.40% | 24.79% | 16.35% | 13.46% | -20.95% | 6.74% |
| Income Tax Expense | 148.00M | 423.00M | 773.00M | -111.00M | 17.60M | -475.20M | -252.40M | -12.20M | 169.30M | -1.32B | 55.10M | 255.90M | 420.10M | 292.00M | 20.80M | 144.20M | 84.10M | 90.90M | 84.80M | -34.90M | -300.00K | 9.10M | -16.30M | -1.50M | -100.00K | 14.40M | 17.70M | 34.50M | 10.70M | 14.70M | 21.10M | 10.60M | 16.30M | 32.80M | 24.40M | 19.60M | 18.30M | -14.20M | 1.90M |
| Net Income | 399.00M | 1.34B | 2.99B | -82.00M | 292.80M | 1.13B | 374.90M | 174.10M | -749.30M | -7.19B | 413.50M | -899.40M | 1.62B | 1.02B | 205.10M | 515.80M | 270.00M | 280.10M | 277.60M | 323.60M | -32.70M | -188.30M | -22.90M | 18.10M | 4.80M | 57.40M | 54.90M | 61.00M | 57.80M | 42.80M | 54.60M | -7.90M | 53.80M | 73.80M | 60.60M | 39.20M | 12.70M | -41.70M | 20.10M |
| Net Income Ratio | 1.81% | 5.81% | 14.62% | -1.53% | 14.71% | 48.37% | 16.09% | 8.26% | -37.22% | -155.48% | 7.27% | -15.31% | 23.83% | 21.78% | 8.76% | 14.29% | 11.87% | 14.58% | 15.96% | 26.82% | -3.81% | -31.46% | -6.93% | 4.21% | 1.33% | 11.62% | 12.51% | 12.12% | 12.55% | 11.01% | 15.34% | -2.54% | 16.95% | 23.81% | 17.29% | 9.97% | 3.50% | -15.63% | 6.16% |
| EPS | 0.78 | 2.57 | 6.00 | -0.22 | 1.06 | 3.80 | 1.30 | 0.88 | -4.89 | -46.96 | 2.40 | -6.32 | 11.55 | 7.54 | 1.64 | 5.07 | 3.19 | 3.27 | 3.13 | 3.74 | -0.40 | -2.33 | -0.29 | 0.22 | 0.05 | 0.64 | 0.60 | 0.66 | 0.61 | 0.44 | 0.57 | -0.08 | 0.57 | 0.79 | 0.65 | 0.36 | 0.07 | -0.42 | 0.18 |
| EPS Diluted | 0.78 | 2.55 | 5.35 | -0.22 | 1.03 | 3.71 | 1.28 | 0.87 | -4.88 | -46.96 | 2.37 | -6.32 | 11.48 | 7.49 | 1.63 | 4.76 | 2.57 | 2.60 | 2.50 | 2.95 | -0.40 | -2.33 | -0.29 | 0.22 | 0.05 | 0.63 | 0.60 | 0.65 | 0.60 | 0.44 | 0.57 | -0.08 | 0.56 | 0.78 | 0.64 | 0.35 | 0.07 | -0.42 | 0.18 |
| Weighted Avg Shares Out | 510.00M | 519.00M | 498.00M | 379.00M | 276.76M | 297.18M | 288.44M | 197.66M | 153.23M | 153.10M | 151.73M | 142.35M | 140.23M | 135.30M | 125.00M | 101.50M | 82.99M | 84.14M | 86.91M | 85.23M | 82.05M | 80.99M | 80.35M | 83.22M | 88.80M | 89.60M | 91.20M | 92.78M | 95.54M | 96.72M | 96.00M | 95.70M | 94.59M | 93.57M | 93.23M | 105.45M | 108.07M | 99.36M | 100.82M |
| Weighted Avg Shares Out (Dil) | 511.00M | 524.00M | 558.00M | 379.00M | 284.48M | 304.14M | 292.96M | 200.15M | 153.61M | 153.10M | 174.32M | 142.35M | 141.01M | 136.14M | 125.80M | 108.30M | 105.03M | 107.65M | 111.35M | 109.68M | 82.05M | 80.99M | 80.35M | 84.19M | 88.80M | 90.40M | 92.00M | 93.31M | 95.93M | 96.72M | 96.42M | 95.70M | 95.43M | 94.31M | 94.14M | 106.95M | 108.07M | 99.36M | 100.82M |

Cleveland-Cliffs Inc. (CLF) Is a Trending Stock: Facts to Know Before Betting on It

Cleveland-Cliffs (CLF) Up 11.1% Since Last Earnings Report: Can It Continue?

Top 3 US steel stocks that will benefit from Trump 2.0

Nucor, Steel Stocks Rise On Goldman Call, Tariff Hopes

Cleveland-Cliffs initiated with a Buy at Goldman Sachs

Investors Heavily Search Cleveland-Cliffs Inc. (CLF): Here is What You Need to Know

Here is What to Know Beyond Why Cleveland-Cliffs Inc. (CLF) is a Trending Stock

Shares of Companies with Big Merger Plans Jump After Trump Election

Cleveland-Cliffs' Q3 Earnings and Revenues Miss Estimates

Cleveland-Cliffs Falls On Q3 Earnings - A Gift For Long-Term Buyers
Source: https://incomestatements.info
Category: Stock Reports
