See more : Shankara Building Products Limited (SHANKARA.NS) Income Statement Analysis – Financial Results
Complete financial analysis of Cleveland-Cliffs Inc. (CLF) income statement, including revenue, profit margins, EPS and key performance metrics. Get detailed insights into the financial performance of Cleveland-Cliffs Inc., a leading company in the Steel industry within the Basic Materials sector.
- Hanvey Group Holdings Limited (8219.HK) Income Statement Analysis – Financial Results
- Sotetsu Holdings, Inc. (9003.T) Income Statement Analysis – Financial Results
- Public Joint-Stock Company PhosAgro (PHOJY) Income Statement Analysis – Financial Results
- Ling Yun Industrial Corporation Limited (600480.SS) Income Statement Analysis – Financial Results
- HIVE Blockchain Technologies Ltd. (HIVE.V) Income Statement Analysis – Financial Results
Cleveland-Cliffs Inc. (CLF)
About Cleveland-Cliffs Inc.
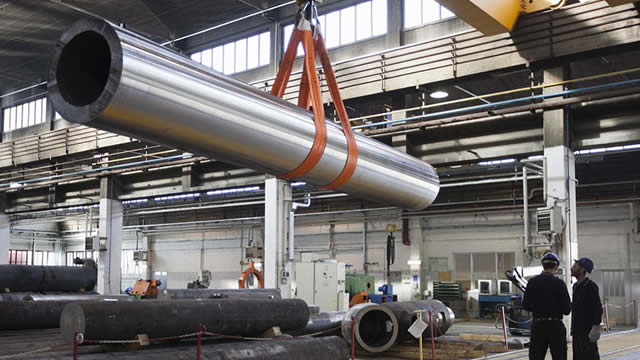
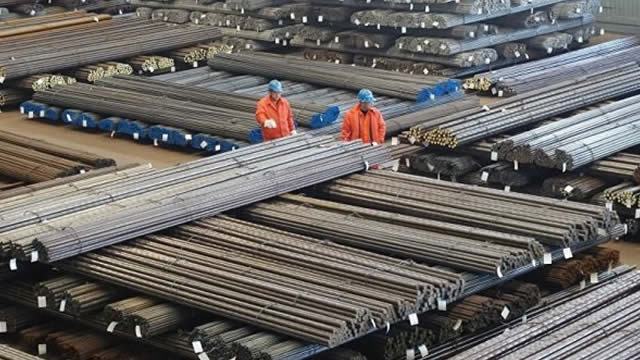
Cleveland-Cliffs Inc. operates as a flat-rolled steel producer in North America. The company offers carbon steel products, such as hot-rolled, cold-rolled, electrogalvanized, hot-dip galvanized, hot-dip galvannealed, aluminized, enameling, and advanced high-strength steel products; stainless steel products; plates; and grain oriented and non-oriented electrical steel products. It also provides tubular components, including carbon steel, stainless steel, and electric resistance welded tubing. In addition, the company offers tinplate products, such as electrolytic tin coated and chrome coated sheet, and tin mill products; tooling and sampling; raw materials; ingots, rolled blooms, and cast blooms; and hot-briquetted iron products. Further, it owns five iron ore mines in Minnesota and Michigan. The company serves automotive, infrastructure and manufacturing, distributors and converters, and steel producers. Cleveland-Cliffs Inc. was formerly known as Cliffs Natural Resources Inc. and changed its name to Cleveland-Cliffs Inc. in August 2017. The company was founded in 1847 and is headquartered in Cleveland, Ohio.
| Metric | 2023 | 2022 | 2021 | 2020 | 2019 | 2018 | 2017 | 2016 | 2015 | 2014 | 2013 | 2012 | 2011 | 2010 | 2009 | 2008 | 2007 | 2006 | 2005 | 2004 | 2003 | 2002 | 2001 | 2000 | 1999 | 1998 | 1997 | 1996 | 1995 | 1994 | 1993 | 1992 | 1991 | 1990 | 1989 | 1988 | 1987 | 1986 | 1985 |
|---|---|---|---|---|---|---|---|---|---|---|---|---|---|---|---|---|---|---|---|---|---|---|---|---|---|---|---|---|---|---|---|---|---|---|---|---|---|---|---|
| Revenue | 22.00B | 22.99B | 20.44B | 5.35B | 1.99B | 2.33B | 2.33B | 2.11B | 2.01B | 4.62B | 5.69B | 5.87B | 6.79B | 4.68B | 2.34B | 3.61B | 2.28B | 1.92B | 1.74B | 1.21B | 857.70M | 598.60M | 330.40M | 430.10M | 361.40M | 493.80M | 438.90M | 503.20M | 460.70M | 388.90M | 355.90M | 310.70M | 317.40M | 309.90M | 350.50M | 393.30M | 363.20M | 266.80M | 326.40M |
| Cost of Revenue | 20.61B | 20.47B | 15.91B | 5.10B | 1.41B | 1.52B | 1.82B | 1.72B | 1.78B | 4.17B | 4.54B | 4.70B | 4.11B | 3.16B | 2.03B | 2.45B | 1.81B | 1.51B | 1.35B | 1.06B | 835.00M | 582.70M | 401.80M | 354.60M | 296.50M | 377.70M | 335.60M | 375.30M | 339.60M | 285.50M | 239.30M | 227.00M | 239.30M | 249.90M | 224.90M | 279.00M | 329.20M | 283.70M | 273.00M |
| Gross Profit | 1.39B | 2.52B | 4.53B | 252.00M | 575.70M | 809.60M | 509.60M | 389.30M | 236.50M | 451.40M | 1.15B | 1.17B | 2.69B | 1.52B | 308.90M | 1.16B | 462.00M | 414.00M | 389.00M | 149.90M | 22.70M | 15.90M | -71.40M | 75.50M | 64.90M | 116.10M | 103.30M | 127.90M | 121.10M | 103.40M | 116.60M | 83.70M | 78.10M | 60.00M | 125.60M | 114.30M | 34.00M | -16.90M | 53.40M |
| Gross Profit Ratio | 6.32% | 10.95% | 22.18% | 4.71% | 28.93% | 34.71% | 21.87% | 18.46% | 11.75% | 9.76% | 20.19% | 19.96% | 39.57% | 32.54% | 13.19% | 32.13% | 20.31% | 21.54% | 22.36% | 12.42% | 2.65% | 2.66% | -21.61% | 17.55% | 17.96% | 23.51% | 23.54% | 25.42% | 26.29% | 26.59% | 32.76% | 26.94% | 24.61% | 19.36% | 35.83% | 29.06% | 9.36% | -6.33% | 16.36% |
| Research & Development | 0.00 | 0.00 | 0.00 | 0.00 | 0.00 | 0.00 | 0.00 | 0.00 | 0.00 | 0.00 | 0.00 | 0.00 | 0.00 | 0.00 | 0.00 | 0.00 | 0.00 | 0.00 | 0.00 | 0.00 | 0.00 | 0.00 | 0.00 | 0.00 | 0.00 | 0.00 | 0.00 | 0.00 | 0.00 | 0.00 | 0.00 | 0.00 | 0.00 | 0.00 | 0.00 | 0.00 | 0.00 | 0.00 | 0.00 |
| General & Administrative | 0.00 | 0.00 | 0.00 | 0.00 | 0.00 | 0.00 | 0.00 | 0.00 | 0.00 | 0.00 | 0.00 | 0.00 | 0.00 | 0.00 | 0.00 | 0.00 | 0.00 | 0.00 | 0.00 | 0.00 | 0.00 | 0.00 | 0.00 | 0.00 | 0.00 | 0.00 | 0.00 | 0.00 | 0.00 | 0.00 | 0.00 | 0.00 | 0.00 | 0.00 | 0.00 | 0.00 | 0.00 | 0.00 | 0.00 |
| Selling & Marketing | 0.00 | 0.00 | 0.00 | 0.00 | 0.00 | 0.00 | 0.00 | 0.00 | 0.00 | 0.00 | 0.00 | 0.00 | 0.00 | 0.00 | 0.00 | 0.00 | 0.00 | 0.00 | 0.00 | 0.00 | 0.00 | 0.00 | 0.00 | 0.00 | 0.00 | 0.00 | 0.00 | 0.00 | 0.00 | 0.00 | 0.00 | 0.00 | 0.00 | 0.00 | 0.00 | 0.00 | 0.00 | 0.00 | 0.00 |
| SG&A | 577.00M | 465.00M | 422.00M | 244.00M | 119.40M | 116.80M | 105.80M | 117.80M | 110.00M | 208.70M | 231.60M | 282.50M | 274.40M | 238.00M | -120.70M | 186.40M | 114.20M | 64.00M | 47.90M | 37.60M | 25.10M | 23.80M | 21.00M | 18.70M | 16.10M | 18.70M | 17.10M | 16.70M | 15.10M | 15.90M | 15.20M | 16.60M | 19.70M | 15.20M | 17.90M | 22.00M | 18.90M | 17.30M | 14.90M |
| Other Expenses | 137.00M | 110.00M | 80.00M | 60.00M | 27.00M | 17.20M | 3.20M | 400.00K | -2.60M | 26.80M | 900.00K | 2.70M | 80.50M | 20.50M | -42.00M | -47.40M | -30.60M | -11.70M | -1.10M | 141.40M | 32.80M | 67.90M | 0.00 | 25.60M | 22.50M | 20.30M | 18.90M | 17.60M | 16.80M | 14.40M | 13.50M | 14.10M | 16.00M | 14.60M | 15.00M | 20.30M | 2.70M | 17.20M | 18.10M |
| Operating Expenses | 714.00M | 575.00M | 502.00M | 304.00M | 146.40M | 136.40M | 78.10M | 148.50M | 81.90M | 443.80M | 227.50M | 431.00M | 354.90M | 258.50M | -78.70M | 220.80M | 83.60M | 52.30M | 46.80M | 179.00M | 25.10M | 23.80M | 21.00M | 44.30M | 38.60M | 39.00M | 36.00M | 34.30M | 31.90M | 30.30M | 28.70M | 30.70M | 35.70M | 29.80M | 32.90M | 42.30M | 21.60M | 34.50M | 33.00M |
| Cost & Expenses | 21.32B | 21.05B | 16.41B | 5.41B | 1.56B | 1.66B | 1.90B | 1.87B | 1.86B | 4.62B | 4.77B | 5.13B | 4.46B | 3.42B | 1.95B | 2.67B | 1.90B | 1.56B | 1.40B | 1.24B | 860.10M | 606.50M | 422.80M | 398.90M | 335.10M | 416.70M | 371.60M | 409.60M | 371.50M | 315.80M | 268.00M | 257.70M | 275.00M | 279.70M | 257.80M | 321.30M | 350.80M | 318.20M | 306.00M |
| Interest Income | 0.00 | 276.00M | 337.00M | 238.00M | 101.00M | 0.00 | 0.00 | 0.00 | 0.00 | 0.00 | 0.00 | 0.00 | 9.50M | 9.90M | 10.80M | 26.20M | 0.00 | 0.00 | 0.00 | 0.00 | 10.60M | 4.80M | 0.00 | 0.00 | 0.00 | 0.00 | 0.00 | 0.00 | 0.00 | 0.00 | 0.00 | 0.00 | 0.00 | 0.00 | 0.00 | 0.00 | 0.00 | 0.00 | 0.00 |
| Interest Expense | 289.00M | 276.00M | 337.00M | 238.00M | 101.20M | 118.90M | 132.00M | 200.50M | 228.50M | 185.20M | 179.10M | 195.60M | 216.50M | 69.70M | 39.00M | 39.80M | 0.00 | 0.00 | 0.00 | 0.00 | 4.60M | 6.60M | 0.00 | 0.00 | 0.00 | 0.00 | 0.00 | 0.00 | 0.00 | 0.00 | 0.00 | 0.00 | 0.00 | 0.00 | 0.00 | 0.00 | 0.00 | 0.00 | 0.00 |
| Depreciation & Amortization | 973.00M | 1.03B | 904.00M | 308.00M | 85.10M | 89.00M | 87.70M | 115.40M | 134.00M | 504.00M | 593.30M | 525.80M | 426.90M | 322.30M | 236.60M | 201.10M | 107.20M | 83.30M | 52.80M | 29.30M | 29.00M | 33.90M | 26.20M | 25.60M | 22.50M | 20.30M | 18.90M | 17.60M | 16.80M | 14.40M | 13.50M | 14.10M | 16.00M | 14.60M | 15.00M | 20.30M | 2.70M | 17.20M | 18.10M |
| EBITDA | 1.86B | 3.11B | 5.04B | 310.00M | 498.40M | 776.00M | 477.90M | 288.00M | 675.60M | -8.91B | 1.26B | 219.60M | 2.88B | 1.69B | 565.50M | 957.20M | 485.60M | 445.00M | 395.00M | 154.30M | -8.00M | 21.40M | 12.60M | 56.60M | 41.70M | 97.40M | 103.00M | 111.20M | 106.00M | 87.50M | 101.40M | 67.10M | 58.40M | 44.80M | 107.70M | 92.30M | 15.10M | -34.20M | 38.50M |
| EBITDA Ratio | 8.45% | 13.85% | 25.17% | 5.85% | 25.96% | 33.42% | 22.42% | 16.91% | 14.21% | 11.64% | 26.64% | 21.62% | 40.77% | 28.10% | 10.29% | 26.74% | 19.64% | 21.69% | 20.87% | -25.63% | 5.00% | 22.54% | -33.44% | 15.11% | 18.46% | 20.72% | 17.84% | 20.81% | 25.42% | 24.81% | 30.06% | 23.72% | 8.48% | -12.17% | 29.24% | 22.20% | -9.25% | -13.87% | 9.01% |
| Operating Income | 677.00M | 1.94B | 4.01B | 5.00M | 429.30M | 673.20M | 431.50M | 240.80M | 151.30M | -9.43B | 671.00M | -308.80M | 2.33B | 1.27B | 230.20M | 938.90M | 378.40M | 361.70M | 342.20M | -29.10M | -2.40M | -7.90M | -92.40M | 31.20M | 26.30M | 77.10M | 67.30M | 93.60M | 89.20M | 73.10M | 87.90M | 53.00M | 42.40M | 30.20M | 92.70M | 72.00M | 12.40M | -51.40M | 20.40M |
| Operating Income Ratio | 3.08% | 8.43% | 19.62% | 0.09% | 21.57% | 28.86% | 18.52% | 11.42% | 7.52% | -203.86% | 11.79% | -5.26% | 34.35% | 27.02% | 9.83% | 26.01% | 16.63% | 18.82% | 19.67% | -2.41% | -0.28% | -1.32% | -27.97% | 7.25% | 7.28% | 15.61% | 15.33% | 18.60% | 19.36% | 18.80% | 24.70% | 17.06% | 13.36% | 9.75% | 26.45% | 18.31% | 3.41% | -19.27% | 6.25% |
| Total Other Income/Expenses | -80.00M | -143.00M | -209.00M | -51.00M | -117.20M | -108.30M | -282.00M | 76.30M | 161.80M | -9.71B | -891.00M | -193.00M | -92.20M | 65.40M | 60.40M | -312.70M | 2.30M | 26.10M | 25.90M | 167.20M | 1.80M | -44.80M | -17.90M | -1.30M | -14.50M | -5.30M | 5.30M | 1.90M | -17.60M | -15.60M | -12.20M | -11.60M | 27.70M | 76.40M | -5.80M | -7.70M | 36.50M | -4.50M | 1.60M |
| Income Before Tax | 597.00M | 1.80B | 3.80B | -193.00M | 312.10M | 564.70M | 137.30M | 207.00M | 313.10M | -9.58B | 489.30M | -501.80M | 2.24B | 1.30B | 290.60M | 716.30M | 380.70M | 387.80M | 368.10M | 285.60M | -35.20M | -57.30M | -53.60M | 16.60M | 4.70M | 71.80M | 72.60M | 95.50M | 71.60M | 57.50M | 75.70M | 41.40M | 70.10M | 106.60M | 86.90M | 64.30M | 48.90M | -55.90M | 22.00M |
| Income Before Tax Ratio | 2.71% | 7.81% | 18.60% | -3.60% | 15.68% | 24.21% | 5.89% | 9.82% | 15.55% | -207.29% | 8.60% | -8.54% | 32.99% | 27.73% | 12.41% | 19.85% | 16.73% | 20.18% | 21.16% | 23.67% | -4.10% | -9.57% | -16.22% | 3.86% | 1.30% | 14.54% | 16.54% | 18.98% | 15.54% | 14.79% | 21.27% | 13.32% | 22.09% | 34.40% | 24.79% | 16.35% | 13.46% | -20.95% | 6.74% |
| Income Tax Expense | 148.00M | 423.00M | 773.00M | -111.00M | 17.60M | -475.20M | -252.40M | -12.20M | 169.30M | -1.32B | 55.10M | 255.90M | 420.10M | 292.00M | 20.80M | 144.20M | 84.10M | 90.90M | 84.80M | -34.90M | -300.00K | 9.10M | -16.30M | -1.50M | -100.00K | 14.40M | 17.70M | 34.50M | 10.70M | 14.70M | 21.10M | 10.60M | 16.30M | 32.80M | 24.40M | 19.60M | 18.30M | -14.20M | 1.90M |
| Net Income | 399.00M | 1.34B | 2.99B | -82.00M | 292.80M | 1.13B | 374.90M | 174.10M | -749.30M | -7.19B | 413.50M | -899.40M | 1.62B | 1.02B | 205.10M | 515.80M | 270.00M | 280.10M | 277.60M | 323.60M | -32.70M | -188.30M | -22.90M | 18.10M | 4.80M | 57.40M | 54.90M | 61.00M | 57.80M | 42.80M | 54.60M | -7.90M | 53.80M | 73.80M | 60.60M | 39.20M | 12.70M | -41.70M | 20.10M |
| Net Income Ratio | 1.81% | 5.81% | 14.62% | -1.53% | 14.71% | 48.37% | 16.09% | 8.26% | -37.22% | -155.48% | 7.27% | -15.31% | 23.83% | 21.78% | 8.76% | 14.29% | 11.87% | 14.58% | 15.96% | 26.82% | -3.81% | -31.46% | -6.93% | 4.21% | 1.33% | 11.62% | 12.51% | 12.12% | 12.55% | 11.01% | 15.34% | -2.54% | 16.95% | 23.81% | 17.29% | 9.97% | 3.50% | -15.63% | 6.16% |
| EPS | 0.78 | 2.57 | 6.00 | -0.22 | 1.06 | 3.80 | 1.30 | 0.88 | -4.89 | -46.96 | 2.40 | -6.32 | 11.55 | 7.54 | 1.64 | 5.07 | 3.19 | 3.27 | 3.13 | 3.74 | -0.40 | -2.33 | -0.29 | 0.22 | 0.05 | 0.64 | 0.60 | 0.66 | 0.61 | 0.44 | 0.57 | -0.08 | 0.57 | 0.79 | 0.65 | 0.36 | 0.07 | -0.42 | 0.18 |
| EPS Diluted | 0.78 | 2.55 | 5.35 | -0.22 | 1.03 | 3.71 | 1.28 | 0.87 | -4.88 | -46.96 | 2.37 | -6.32 | 11.48 | 7.49 | 1.63 | 4.76 | 2.57 | 2.60 | 2.50 | 2.95 | -0.40 | -2.33 | -0.29 | 0.22 | 0.05 | 0.63 | 0.60 | 0.65 | 0.60 | 0.44 | 0.57 | -0.08 | 0.56 | 0.78 | 0.64 | 0.35 | 0.07 | -0.42 | 0.18 |
| Weighted Avg Shares Out | 510.00M | 519.00M | 498.00M | 379.00M | 276.76M | 297.18M | 288.44M | 197.66M | 153.23M | 153.10M | 151.73M | 142.35M | 140.23M | 135.30M | 125.00M | 101.50M | 82.99M | 84.14M | 86.91M | 85.23M | 82.05M | 80.99M | 80.35M | 83.22M | 88.80M | 89.60M | 91.20M | 92.78M | 95.54M | 96.72M | 96.00M | 95.70M | 94.59M | 93.57M | 93.23M | 105.45M | 108.07M | 99.36M | 100.82M |
| Weighted Avg Shares Out (Dil) | 511.00M | 524.00M | 558.00M | 379.00M | 284.48M | 304.14M | 292.96M | 200.15M | 153.61M | 153.10M | 174.32M | 142.35M | 141.01M | 136.14M | 125.80M | 108.30M | 105.03M | 107.65M | 111.35M | 109.68M | 82.05M | 80.99M | 80.35M | 84.19M | 88.80M | 90.40M | 92.00M | 93.31M | 95.93M | 96.72M | 96.42M | 95.70M | 95.43M | 94.31M | 94.14M | 106.95M | 108.07M | 99.36M | 100.82M |

How Will A Cooling U.S. Economy Impact Cleveland-Cliffs Q2 Earnings?

Cleveland-Cliffs (CLF) Rises Higher Than Market: Key Facts

Cleveland-Cliffs Q2 2024 Earnings: Short-Term Tailwinds, But Not A Buy Yet

Cleveland-Cliffs (CLF) Stock Sinks As Market Gains: Here's Why

Cleveland-Cliffs: Buy The Dip, Challenges Are Likely Temporary

Cleveland-Cliffs to Announce Second-Quarter 2024 Earnings Results on July 22 and Host Conference Call on July 23

3 Stocks at 52-Week Lows with Insider Buying

Cleveland-Cliffs Posts Press Conference and Q&A with U.S. Senator Sherrod Brown and USW International President David McCall on Website

Cleveland-Cliffs (CLF) Stock Sinks As Market Gains: Here's Why

Cleveland-Cliffs (CLF) Suffers a Larger Drop Than the General Market: Key Insights
Source: https://incomestatements.info
Category: Stock Reports
