See more : Clarity Pharmaceuticals Ltd (CU6.AX) Income Statement Analysis – Financial Results
Complete financial analysis of Ørsted A/S (DNNGY) income statement, including revenue, profit margins, EPS and key performance metrics. Get detailed insights into the financial performance of Ørsted A/S, a leading company in the Renewable Utilities industry within the Utilities sector.
- Arrow Exploration Corp. (AXL.V) Income Statement Analysis – Financial Results
- Shihlin Paper Corporation (1903.TW) Income Statement Analysis – Financial Results
- EnWave Corporation (ENW.V) Income Statement Analysis – Financial Results
- Kukdong Oil & Chemicals Co.,Ltd (014530.KS) Income Statement Analysis – Financial Results
- Chugokukogyo Co.,Ltd. (5974.T) Income Statement Analysis – Financial Results
Ørsted A/S (DNNGY)
About Ørsted A/S
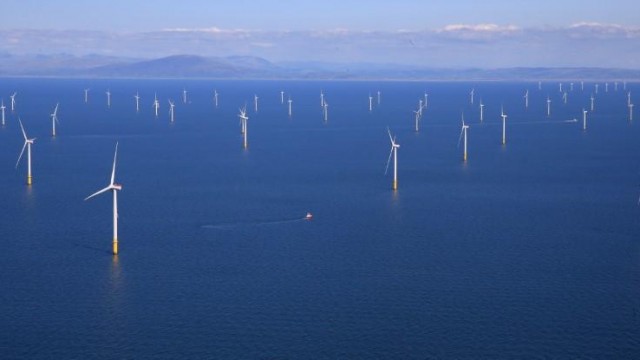
Ørsted A/S, together with its subsidiaries, develops, constructs, owns, and operates offshore and onshore wind farms, solar farms, energy storage facilities, and bioenergy plants. It operates through Offshore, Onshore, and Markets & Bioenergy segments. The Offshore segment develops, constructs, owns, and operates offshore wind farms in the United Kingdom, Germany, Denmark, the Netherlands, the United States, Taiwan, Japan, and South Korea. The Onshore segment develops, owns, and operates onshore wind and solar farms in the United States. The Markets & Bioenergy segment engages in the generation of heat and power from combined heat and power plants in Denmark; sells power and gas in the wholesale and B2B markets; and optimizes and hedges energy portfolio. The company was formerly known as DONG Energy A/S and changed its name to Ørsted A/S in November 2017. Ørsted A/S was founded in 1972 and is headquartered in Fredericia, Denmark.
| Metric | 2023 | 2022 | 2021 | 2020 | 2019 | 2018 | 2017 | 2016 | 2015 | 2014 | 2013 | 2012 |
|---|---|---|---|---|---|---|---|---|---|---|---|---|
| Revenue | 69.08B | 126.09B | 69.14B | 37.10B | 59.34B | 68.65B | 59.71B | 57.39B | 74.39B | 71.83B | 72.20B | 65.86B |
| Cost of Revenue | 46.62B | 97.16B | 53.11B | 25.78B | 42.84B | 54.02B | 40.69B | 37.62B | 45.07B | 43.06B | 47.12B | 47.51B |
| Gross Profit | 22.45B | 28.93B | 16.03B | 11.32B | 16.50B | 14.63B | 19.02B | 19.77B | 29.32B | 28.77B | 25.08B | 18.35B |
| Gross Profit Ratio | 32.50% | 22.94% | 23.18% | 30.50% | 27.81% | 21.31% | 31.85% | 34.45% | 39.41% | 40.05% | 34.73% | 27.86% |
| Research & Development | 2.31B | 2.13B | 2.16B | 1.94B | 2.06B | 0.00 | 0.00 | 0.00 | 0.00 | 0.00 | 0.00 | 0.00 |
| General & Administrative | 0.00 | 7.05B | 5.76B | 5.77B | 6.09B | 5.87B | 4.24B | 4.08B | 0.00 | 0.00 | 0.00 | 0.00 |
| Selling & Marketing | 0.00 | 0.00 | 0.00 | 0.00 | 0.00 | 0.00 | 0.00 | 0.00 | 0.00 | 0.00 | 0.00 | 0.00 |
| SG&A | 13.78B | 7.05B | 5.76B | 5.77B | 6.09B | 5.87B | 4.24B | 4.08B | 6.57B | 10.48B | 10.45B | 11.78B |
| Other Expenses | 34.40B | 8.49B | 1.98B | -2.09B | -706.00M | -951.00M | 9.20B | 6.95B | 33.61B | 27.78B | 23.48B | 0.00 |
| Operating Expenses | 50.48B | 15.54B | 7.74B | 3.68B | 5.39B | 4.91B | 13.44B | 11.03B | 33.61B | 27.78B | 23.48B | 21.42B |
| Cost & Expenses | 86.93B | 112.70B | 60.85B | 29.47B | 48.22B | 58.93B | 54.14B | 48.65B | 78.68B | 70.84B | 70.60B | 68.94B |
| Interest Income | 1.64B | 368.00M | 335.00M | 823.00M | 291.00M | 326.00M | 287.00M | 459.00M | 718.00M | 672.00M | 564.00M | 1.10B |
| Interest Expense | 4.28B | 2.85B | 1.84B | 2.56B | 2.06B | 1.48B | 1.22B | 1.16B | 2.11B | 2.35B | 2.73B | 0.00 |
| Depreciation & Amortization | 9.80B | 9.75B | 7.97B | 7.59B | 6.86B | 5.98B | 5.74B | 5.23B | 25.73B | 17.57B | 13.04B | 9.07B |
| EBITDA | -7.70B | 27.34B | 23.85B | 27.49B | 19.82B | 29.61B | 22.09B | 9.54B | 10.03B | 21.74B | 15.11B | 7.92B |
| EBITDA Ratio | -11.15% | 20.33% | 23.35% | 42.02% | 32.37% | 22.25% | 19.96% | 24.81% | 29.60% | 26.55% | 19.77% | 10.69% |
| Operating Income | -17.85B | 13.37B | 8.04B | 9.01B | 11.59B | 9.90B | 5.64B | 9.01B | -3.71B | 1.51B | 1.24B | -2.02B |
| Operating Income Ratio | -25.85% | 10.60% | 11.63% | 24.29% | 19.53% | 14.42% | 9.44% | 15.70% | -4.99% | 2.10% | 1.71% | -3.07% |
| Total Other Income/Expenses | -1.17B | -2.17B | -2.92B | 8.31B | -1.20B | -1.15B | -1.19B | 475.00M | -1.36B | -941.00M | -1.81B | -1.61B |
| Income Before Tax | -19.03B | 17.61B | 13.28B | 17.32B | 10.39B | 21.97B | 15.10B | 12.18B | -5.93B | 1.83B | -576.00M | -4.18B |
| Income Before Tax Ratio | -27.54% | 13.97% | 19.20% | 46.69% | 17.51% | 32.00% | 25.29% | 21.23% | -7.97% | 2.54% | -0.80% | -6.34% |
| Income Tax Expense | 1.16B | 2.61B | 2.39B | 1.78B | 3.10B | 3.70B | 1.78B | 1.72B | 3.52B | 4.14B | 1.02B | 949.00M |
| Net Income | -20.51B | 15.13B | 10.96B | 15.60B | 7.18B | 18.25B | 13.32B | 8.05B | -9.45B | -2.31B | -1.59B | -4.69B |
| Net Income Ratio | -29.69% | 12.00% | 15.86% | 42.04% | 12.10% | 26.59% | 22.31% | 14.02% | -12.71% | -3.22% | -2.20% | -7.12% |
| EPS | -50.11 | 34.62 | 24.33 | 35.97 | 15.49 | 43.44 | 31.70 | 18.10 | -22.63 | -5.77 | -5.42 | -15.95 |
| EPS Diluted | -50.08 | 34.60 | 24.32 | 35.95 | 15.47 | 43.39 | 31.68 | 18.10 | -22.56 | -5.75 | -5.42 | -15.95 |
| Weighted Avg Shares Out | 420.23M | 420.21M | 420.15M | 420.06M | 420.08M | 420.14M | 420.16M | 419.01M | 417.73M | 400.16M | 293.71M | 293.71M |
| Weighted Avg Shares Out (Dil) | 420.51M | 420.44M | 420.38M | 420.36M | 420.49M | 420.61M | 420.43M | 420.31M | 419.04M | 401.47M | 293.71M | 293.71M |

7 Dividend Growth Stocks For 2022

Offshore Wind - Time To Reconsider Ørsted As Share Price Drifts

Ørsted: Go Against The Wind And Buy This Dip

7 Best ESG Stocks to Buy for Holistic Profitability

Ørsted A/S (DNNGY) CEO Mads Nipper on Q3 2021 Results - Earnings Call Transcript

Orsted's Q3 profit lags as lower wind speeds bite

REWE Group and Ørsted sign long-term power purchase agreement for future German offshore wind farm

Ørsted appoints new CEO of Ørsted Onshore

Orsted: This Green Energy Giant Is A Buy

FAN: Facing Immediate Headwinds Suggesting Underperformance
Source: https://incomestatements.info
Category: Stock Reports
