See more : Round One Corporation (RNDOF) Income Statement Analysis – Financial Results
Complete financial analysis of Ørsted A/S (DNNGY) income statement, including revenue, profit margins, EPS and key performance metrics. Get detailed insights into the financial performance of Ørsted A/S, a leading company in the Renewable Utilities industry within the Utilities sector.
- Thunder Bridge Capital Partners IV Inc. (THCPU) Income Statement Analysis – Financial Results
- Cazaly Resources Limited (CAZ.AX) Income Statement Analysis – Financial Results
- Zhejiang Sanfer Electric Co., Ltd (605336.SS) Income Statement Analysis – Financial Results
- Restaurant Brands Asia Limited (RBA.BO) Income Statement Analysis – Financial Results
- AerSale Corporation (ASLEW) Income Statement Analysis – Financial Results
Ørsted A/S (DNNGY)
About Ørsted A/S
Ørsted A/S, together with its subsidiaries, develops, constructs, owns, and operates offshore and onshore wind farms, solar farms, energy storage facilities, and bioenergy plants. It operates through Offshore, Onshore, and Markets & Bioenergy segments. The Offshore segment develops, constructs, owns, and operates offshore wind farms in the United Kingdom, Germany, Denmark, the Netherlands, the United States, Taiwan, Japan, and South Korea. The Onshore segment develops, owns, and operates onshore wind and solar farms in the United States. The Markets & Bioenergy segment engages in the generation of heat and power from combined heat and power plants in Denmark; sells power and gas in the wholesale and B2B markets; and optimizes and hedges energy portfolio. The company was formerly known as DONG Energy A/S and changed its name to Ørsted A/S in November 2017. Ørsted A/S was founded in 1972 and is headquartered in Fredericia, Denmark.
| Metric | 2023 | 2022 | 2021 | 2020 | 2019 | 2018 | 2017 | 2016 | 2015 | 2014 | 2013 | 2012 |
|---|---|---|---|---|---|---|---|---|---|---|---|---|
| Revenue | 69.08B | 126.09B | 69.14B | 37.10B | 59.34B | 68.65B | 59.71B | 57.39B | 74.39B | 71.83B | 72.20B | 65.86B |
| Cost of Revenue | 46.62B | 97.16B | 53.11B | 25.78B | 42.84B | 54.02B | 40.69B | 37.62B | 45.07B | 43.06B | 47.12B | 47.51B |
| Gross Profit | 22.45B | 28.93B | 16.03B | 11.32B | 16.50B | 14.63B | 19.02B | 19.77B | 29.32B | 28.77B | 25.08B | 18.35B |
| Gross Profit Ratio | 32.50% | 22.94% | 23.18% | 30.50% | 27.81% | 21.31% | 31.85% | 34.45% | 39.41% | 40.05% | 34.73% | 27.86% |
| Research & Development | 0.00 | 2.13B | 2.16B | 1.94B | 2.06B | 0.00 | 0.00 | 0.00 | 0.00 | 0.00 | 0.00 | 0.00 |
| General & Administrative | 0.00 | 7.05B | 5.76B | 5.77B | 6.09B | 5.87B | 4.24B | 4.08B | 3.26B | 0.00 | 0.00 | 0.00 |
| Selling & Marketing | 0.00 | 0.00 | 0.00 | 0.00 | 0.00 | 0.00 | 0.00 | 0.00 | 0.00 | 0.00 | 0.00 | 0.00 |
| SG&A | 13.78B | 7.05B | 5.76B | 5.77B | 6.09B | 5.87B | 4.24B | 4.08B | 3.26B | 10.48B | 10.45B | 11.78B |
| Other Expenses | 26.53B | 0.00 | 0.00 | 0.00 | 0.00 | 0.00 | 0.00 | 0.00 | 0.00 | 0.00 | 0.00 | 0.00 |
| Operating Expenses | 40.31B | 15.54B | 7.74B | 3.68B | 5.39B | 4.91B | 13.44B | 11.03B | 33.61B | 27.78B | 23.48B | 21.42B |
| Cost & Expenses | 86.93B | 112.70B | 60.85B | 29.47B | 48.22B | 58.93B | 54.14B | 48.65B | 78.68B | 70.84B | 70.60B | 68.94B |
| Interest Income | 637.00M | 368.00M | 335.00M | 823.00M | 291.00M | 326.00M | 287.00M | 459.00M | 718.00M | 672.00M | 564.00M | 1.10B |
| Interest Expense | 4.28B | 2.85B | 1.84B | 2.56B | 2.06B | 1.48B | 1.22B | 1.16B | 2.11B | 2.35B | 2.73B | 0.00 |
| Depreciation & Amortization | 9.80B | 9.75B | 7.97B | 7.59B | 6.86B | 5.98B | 5.74B | 5.23B | 25.73B | 17.57B | 12.96B | 9.07B |
| EBITDA | -4.95B | 25.63B | 21.24B | 15.59B | 19.21B | 28.83B | 22.60B | 14.24B | 10.03B | 21.74B | 15.11B | 7.04B |
| EBITDA Ratio | -7.17% | 20.33% | 23.35% | 42.02% | 32.37% | 22.25% | 19.96% | 24.81% | 29.60% | 26.55% | 19.77% | 10.69% |
| Operating Income | -17.85B | 19.77B | 8.04B | 9.01B | 11.59B | 23.12B | 16.29B | 11.71B | -3.81B | 2.77B | 1.24B | -2.02B |
| Operating Income Ratio | -25.85% | 15.68% | 11.63% | 24.29% | 19.53% | 33.67% | 27.28% | 20.40% | -5.12% | 3.85% | 1.71% | -3.07% |
| Total Other Income/Expenses | -1.17B | -2.17B | 4.86B | 8.31B | -1.20B | 14.44B | -1.19B | 475.00M | -1.98B | -7.40B | -7.18B | -2.15B |
| Income Before Tax | -19.03B | 17.61B | 13.28B | 17.32B | 10.39B | 21.97B | 15.10B | 12.18B | -5.93B | 1.83B | -576.00M | -4.18B |
| Income Before Tax Ratio | -27.54% | 13.97% | 19.20% | 46.69% | 17.51% | 32.00% | 25.29% | 21.23% | -7.97% | 2.54% | -0.80% | -6.34% |
| Income Tax Expense | 1.16B | 2.61B | 2.39B | 1.78B | 3.10B | 3.70B | 1.78B | 1.72B | 3.52B | 4.14B | 1.02B | 949.00M |
| Net Income | -20.51B | 15.13B | 10.96B | 15.60B | 6.51B | 17.83B | 18.72B | 7.55B | -9.48B | -2.39B | -1.56B | -4.69B |
| Net Income Ratio | -29.69% | 12.00% | 15.86% | 42.04% | 10.96% | 25.97% | 31.35% | 13.15% | -12.75% | -3.32% | -2.16% | -7.12% |
| EPS | -51.46 | 34.62 | 24.33 | 35.97 | 15.49 | 42.43 | 30.02 | 24.05 | -22.63 | -1.99 | -1.77 | -15.95 |
| EPS Diluted | -50.08 | 34.60 | 24.32 | 35.95 | 15.47 | 42.38 | 30.01 | 23.98 | -22.23 | -1.98 | -1.77 | -15.95 |
| Weighted Avg Shares Out | 409.19M | 420.21M | 420.15M | 420.06M | 420.08M | 420.14M | 420.43M | 420.31M | 419.04M | 1.20B | 881.14M | 293.71M |
| Weighted Avg Shares Out (Dil) | 420.51M | 420.44M | 420.38M | 420.36M | 420.49M | 420.61M | 420.43M | 420.31M | 426.54M | 1.20B | 881.14M | 293.71M |

Orsted A/S. (DNNGY) Q2 2024 Earnings Call Transcript

Wind developer Orsted does not rule out Chinese turbine technology
Orsted posts Q2 profits above expectations, keeps guidance unchanged

Orsted Invests In Tesla-Powered Battery Storage In UK: Details
Orsted to install Tesla battery for UK offshore wind farm
New York finalizes offshore wind contracts for Equinor, Orsted projects
Orsted, New Jersey reach settlement over canceled offshore wind farms
Orsted receives $650 mln tax equity financing from J.P. Morgan
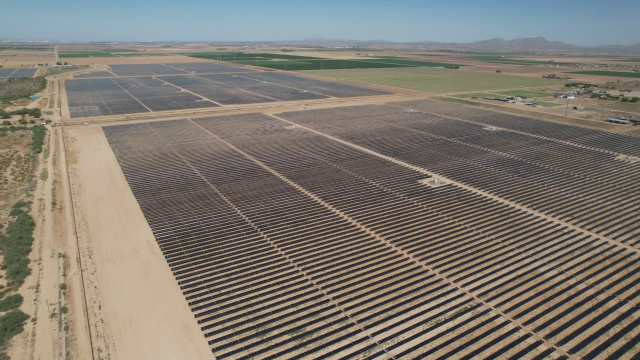
Denmark's Orsted wins $680 million JPMorgan backing for U.S. solar and battery projects

Orsted: Getting Back On Track
Source: https://incomestatements.info
Category: Stock Reports
