See more : Siltronic AG (WAF.SW) Income Statement Analysis – Financial Results
Complete financial analysis of Ørsted A/S (DNNGY) income statement, including revenue, profit margins, EPS and key performance metrics. Get detailed insights into the financial performance of Ørsted A/S, a leading company in the Renewable Utilities industry within the Utilities sector.
- Beijing Beimo High-tech Frictional Material Co.,Ltd (002985.SZ) Income Statement Analysis – Financial Results
- Euro Manganese Inc. (EMN.AX) Income Statement Analysis – Financial Results
- Deltex Medical Group plc (DEMG.L) Income Statement Analysis – Financial Results
- CW Petroleum Corp (CWPE) Income Statement Analysis – Financial Results
- Coty Inc. (CO3A.DE) Income Statement Analysis – Financial Results
Ørsted A/S (DNNGY)
About Ørsted A/S
Ørsted A/S, together with its subsidiaries, develops, constructs, owns, and operates offshore and onshore wind farms, solar farms, energy storage facilities, and bioenergy plants. It operates through Offshore, Onshore, and Markets & Bioenergy segments. The Offshore segment develops, constructs, owns, and operates offshore wind farms in the United Kingdom, Germany, Denmark, the Netherlands, the United States, Taiwan, Japan, and South Korea. The Onshore segment develops, owns, and operates onshore wind and solar farms in the United States. The Markets & Bioenergy segment engages in the generation of heat and power from combined heat and power plants in Denmark; sells power and gas in the wholesale and B2B markets; and optimizes and hedges energy portfolio. The company was formerly known as DONG Energy A/S and changed its name to Ørsted A/S in November 2017. Ørsted A/S was founded in 1972 and is headquartered in Fredericia, Denmark.
| Metric | 2023 | 2022 | 2021 | 2020 | 2019 | 2018 | 2017 | 2016 | 2015 | 2014 | 2013 | 2012 |
|---|---|---|---|---|---|---|---|---|---|---|---|---|
| Revenue | 69.08B | 126.09B | 69.14B | 37.10B | 59.34B | 68.65B | 59.71B | 57.39B | 74.39B | 71.83B | 72.20B | 65.86B |
| Cost of Revenue | 46.62B | 97.16B | 53.11B | 25.78B | 42.84B | 54.02B | 40.69B | 37.62B | 45.07B | 43.06B | 47.12B | 47.51B |
| Gross Profit | 22.45B | 28.93B | 16.03B | 11.32B | 16.50B | 14.63B | 19.02B | 19.77B | 29.32B | 28.77B | 25.08B | 18.35B |
| Gross Profit Ratio | 32.50% | 22.94% | 23.18% | 30.50% | 27.81% | 21.31% | 31.85% | 34.45% | 39.41% | 40.05% | 34.73% | 27.86% |
| Research & Development | 0.00 | 2.13B | 2.16B | 1.94B | 2.06B | 0.00 | 0.00 | 0.00 | 0.00 | 0.00 | 0.00 | 0.00 |
| General & Administrative | 0.00 | 7.05B | 5.76B | 5.77B | 6.09B | 5.87B | 4.24B | 4.08B | 3.26B | 0.00 | 0.00 | 0.00 |
| Selling & Marketing | 0.00 | 0.00 | 0.00 | 0.00 | 0.00 | 0.00 | 0.00 | 0.00 | 0.00 | 0.00 | 0.00 | 0.00 |
| SG&A | 13.78B | 7.05B | 5.76B | 5.77B | 6.09B | 5.87B | 4.24B | 4.08B | 3.26B | 10.48B | 10.45B | 11.78B |
| Other Expenses | 26.53B | 0.00 | 0.00 | 0.00 | 0.00 | 0.00 | 0.00 | 0.00 | 0.00 | 0.00 | 0.00 | 0.00 |
| Operating Expenses | 40.31B | 15.54B | 7.74B | 3.68B | 5.39B | 4.91B | 13.44B | 11.03B | 33.61B | 27.78B | 23.48B | 21.42B |
| Cost & Expenses | 86.93B | 112.70B | 60.85B | 29.47B | 48.22B | 58.93B | 54.14B | 48.65B | 78.68B | 70.84B | 70.60B | 68.94B |
| Interest Income | 637.00M | 368.00M | 335.00M | 823.00M | 291.00M | 326.00M | 287.00M | 459.00M | 718.00M | 672.00M | 564.00M | 1.10B |
| Interest Expense | 4.28B | 2.85B | 1.84B | 2.56B | 2.06B | 1.48B | 1.22B | 1.16B | 2.11B | 2.35B | 2.73B | 0.00 |
| Depreciation & Amortization | 9.80B | 9.75B | 7.97B | 7.59B | 6.86B | 5.98B | 5.74B | 5.23B | 25.73B | 17.57B | 12.96B | 9.07B |
| EBITDA | -4.95B | 25.63B | 21.24B | 15.59B | 19.21B | 28.83B | 22.60B | 14.24B | 10.03B | 21.74B | 15.11B | 7.04B |
| EBITDA Ratio | -7.17% | 20.33% | 23.35% | 42.02% | 32.37% | 22.25% | 19.96% | 24.81% | 29.60% | 26.55% | 19.77% | 10.69% |
| Operating Income | -17.85B | 19.77B | 8.04B | 9.01B | 11.59B | 23.12B | 16.29B | 11.71B | -3.81B | 2.77B | 1.24B | -2.02B |
| Operating Income Ratio | -25.85% | 15.68% | 11.63% | 24.29% | 19.53% | 33.67% | 27.28% | 20.40% | -5.12% | 3.85% | 1.71% | -3.07% |
| Total Other Income/Expenses | -1.17B | -2.17B | 4.86B | 8.31B | -1.20B | 14.44B | -1.19B | 475.00M | -1.98B | -7.40B | -7.18B | -2.15B |
| Income Before Tax | -19.03B | 17.61B | 13.28B | 17.32B | 10.39B | 21.97B | 15.10B | 12.18B | -5.93B | 1.83B | -576.00M | -4.18B |
| Income Before Tax Ratio | -27.54% | 13.97% | 19.20% | 46.69% | 17.51% | 32.00% | 25.29% | 21.23% | -7.97% | 2.54% | -0.80% | -6.34% |
| Income Tax Expense | 1.16B | 2.61B | 2.39B | 1.78B | 3.10B | 3.70B | 1.78B | 1.72B | 3.52B | 4.14B | 1.02B | 949.00M |
| Net Income | -20.51B | 15.13B | 10.96B | 15.60B | 6.51B | 17.83B | 18.72B | 7.55B | -9.48B | -2.39B | -1.56B | -4.69B |
| Net Income Ratio | -29.69% | 12.00% | 15.86% | 42.04% | 10.96% | 25.97% | 31.35% | 13.15% | -12.75% | -3.32% | -2.16% | -7.12% |
| EPS | -51.46 | 34.62 | 24.33 | 35.97 | 15.49 | 42.43 | 30.02 | 24.05 | -22.63 | -1.99 | -1.77 | -15.95 |
| EPS Diluted | -50.08 | 34.60 | 24.32 | 35.95 | 15.47 | 42.38 | 30.01 | 23.98 | -22.23 | -1.98 | -1.77 | -15.95 |
| Weighted Avg Shares Out | 409.19M | 420.21M | 420.15M | 420.06M | 420.08M | 420.14M | 420.43M | 420.31M | 419.04M | 1.20B | 881.14M | 293.71M |
| Weighted Avg Shares Out (Dil) | 420.51M | 420.44M | 420.38M | 420.36M | 420.49M | 420.61M | 420.43M | 420.31M | 426.54M | 1.20B | 881.14M | 293.71M |
US gives final nod to Rhode Island's $1.5 billion offshore wind farm
Orsted South Fork offshore wind farm delivers first power to NY electric grid
Orsted wins licence for South Korea offshore wind project
Orsted wants more help from UK government for offshore wind farm
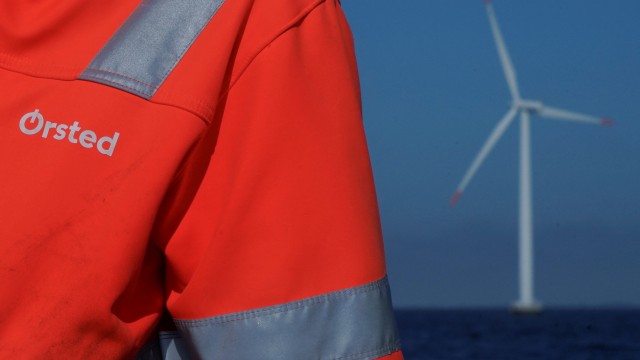
Orsted's finance and operations chiefs out after big losses

Orsted pulls out of Norway offshore wind consortium
2 Of My Favorite Beaten Down Renewable Energy Picks
Ship shortage dealt death blow to Orsted's NJ offshore wind hopes
Fitch follows S&P in cutting Orsted's outlook

Wind power is losing in New Jersey, but winning in Virginia. Here's where the rest of the U.S. stands.
Source: https://incomestatements.info
Category: Stock Reports
