See more : West Japan Railway Company (WJRYF) Income Statement Analysis – Financial Results
Complete financial analysis of BlackRock Debt Strategies Fund, Inc. (DSU) income statement, including revenue, profit margins, EPS and key performance metrics. Get detailed insights into the financial performance of BlackRock Debt Strategies Fund, Inc., a leading company in the Asset Management industry within the Financial Services sector.
- Infotel SA (INF.PA) Income Statement Analysis – Financial Results
- SQID Technologies Limited (SQID.CN) Income Statement Analysis – Financial Results
- Zoomlion Heavy Industry Science and Technology Co., Ltd. (1157.HK) Income Statement Analysis – Financial Results
- CN Logistics International Holdings Limited (2130.HK) Income Statement Analysis – Financial Results
- Pondy Oxides And Chemicals Limited (POCL.NS) Income Statement Analysis – Financial Results
BlackRock Debt Strategies Fund, Inc. (DSU)
Industry: Asset Management
Sector: Financial Services
Website: https://www.blackrock.com/investing/products/240192/blackrock-debt-strategies-fund-inc-usd-fund
About BlackRock Debt Strategies Fund, Inc.
BlackRock Debt Strategies Fund, Inc. is a closed ended fixed income mutual fund launched by BlackRock, Inc. The fund is managed by BlackRock Advisors, LLC. It invests in fixed income markets of the United States. The fund primarily invests in a diversified portfolio of companies' debt instruments, including corporate loans, which are rated in the lower rating categories of the established rating services (BBB or lower by S&P's or Baa or lower by Moody's) or unrated debt instruments, which are in the judgment of the investment adviser of equivalent quality. It was formerly known as Debt Strategies Fund Inc. BlackRock Debt Strategies Fund, Inc. was formed on March 27, 1998 and is domiciled in the United States.
| Metric | 2023 | 2022 | 2021 | 2020 | 2019 | 2018 | 2011 |
|---|---|---|---|---|---|---|---|
| Revenue | 49.67M | -19.44M | 35.07M | 1.39M | 19.21M | 43.37M | 0.00 |
| Cost of Revenue | 3.72M | 4.10M | 4.64M | 4.44M | 4.45M | 0.00 | 0.00 |
| Gross Profit | 45.95M | -23.54M | 30.42M | -3.05M | 14.76M | 43.37M | 0.00 |
| Gross Profit Ratio | 92.51% | 121.08% | 86.76% | -218.93% | 76.82% | 100.00% | 0.00% |
| Research & Development | 0.00 | 0.00 | 0.00 | 0.00 | 0.00 | 0.00 | 0.00 |
| General & Administrative | 356.15K | 296.94K | 518.05K | 528.71K | 894.96K | 971.29K | 0.00 |
| Selling & Marketing | 0.00 | 0.00 | 0.00 | 0.00 | 0.00 | 0.00 | 0.00 |
| SG&A | 356.15K | 296.94K | 518.05K | 528.71K | 894.96K | 971.29K | 0.00 |
| Other Expenses | 32.12M | 1.72K | 169.08K | 154.83K | 201.26K | 88.98K | 0.00 |
| Operating Expenses | -32.12M | 298.66K | 687.13K | 683.54K | 1.10M | 1.06M | 0.00 |
| Cost & Expenses | -28.40M | 298.66K | 687.13K | 683.54K | 1.10M | 1.06M | 0.00 |
| Interest Income | 57.54M | 42.51M | 34.81M | 36.66M | 56.52M | 60.55M | 0.00 |
| Interest Expense | 8.35M | 5.30M | 2.28M | 2.99M | 8.41M | 6.96M | 0.00 |
| Depreciation & Amortization | 167.90K | 228.49K | 236.56K | 206.30K | 171.86K | 161.14K | 0.00 |
| EBITDA | 78.07M | -14.44M | 34.38M | 710.13K | 26.52M | 49.27M | 0.00 |
| EBITDA Ratio | 157.17% | 74.26% | 98.04% | 50.95% | 138.06% | 113.61% | 0.00% |
| Operating Income | 78.07M | -14.44M | 34.38M | 710.13K | 26.52M | 49.27M | 0.00 |
| Operating Income Ratio | 157.17% | 74.26% | 98.04% | 50.95% | 138.06% | 113.61% | 0.00% |
| Total Other Income/Expenses | -8.46M | -5.30M | -2.35M | -2.94M | -8.41M | -6.96M | 0.00 |
| Income Before Tax | 69.61M | -19.74M | 34.38M | 710.13K | 18.11M | 42.31M | 0.00 |
| Income Before Tax Ratio | 140.15% | 101.54% | 98.04% | 50.95% | 94.29% | 97.56% | 0.00% |
| Income Tax Expense | 54.47M | 38.83M | 28.24M | 30.09M | 46.50M | 0.00 | 0.00 |
| Net Income | 69.61M | -19.74M | 34.38M | 710.13K | 18.11M | 42.31M | 0.00 |
| Net Income Ratio | 140.15% | 101.54% | 98.04% | 50.95% | 94.29% | 97.56% | 0.00% |
| EPS | 1.49 | -0.42 | 0.74 | 0.02 | 0.37 | 0.74 | 0.00 |
| EPS Diluted | 1.49 | -0.42 | 0.74 | 0.02 | 0.37 | 0.74 | 0.00 |
| Weighted Avg Shares Out | 46.61M | 46.61M | 46.61M | 46.59M | 49.42M | 57.18M | 35.92M |
| Weighted Avg Shares Out (Dil) | 46.61M | 46.61M | 46.61M | 46.59M | 49.42M | 57.18M | 35.92M |
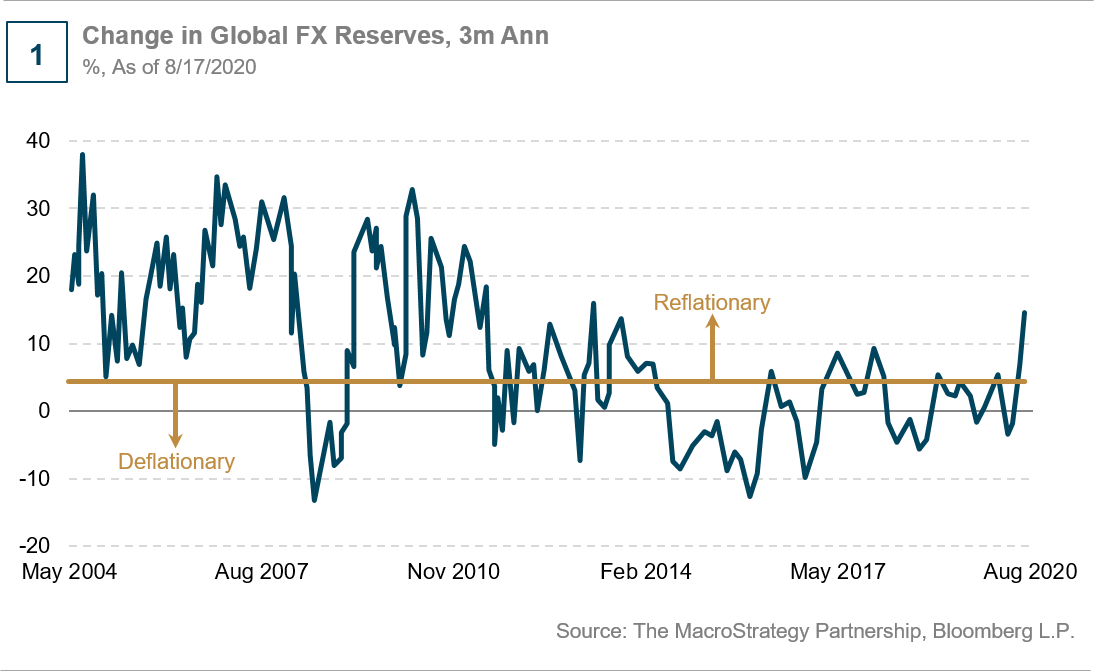
A Cyclical Rotation In Corporate Credit
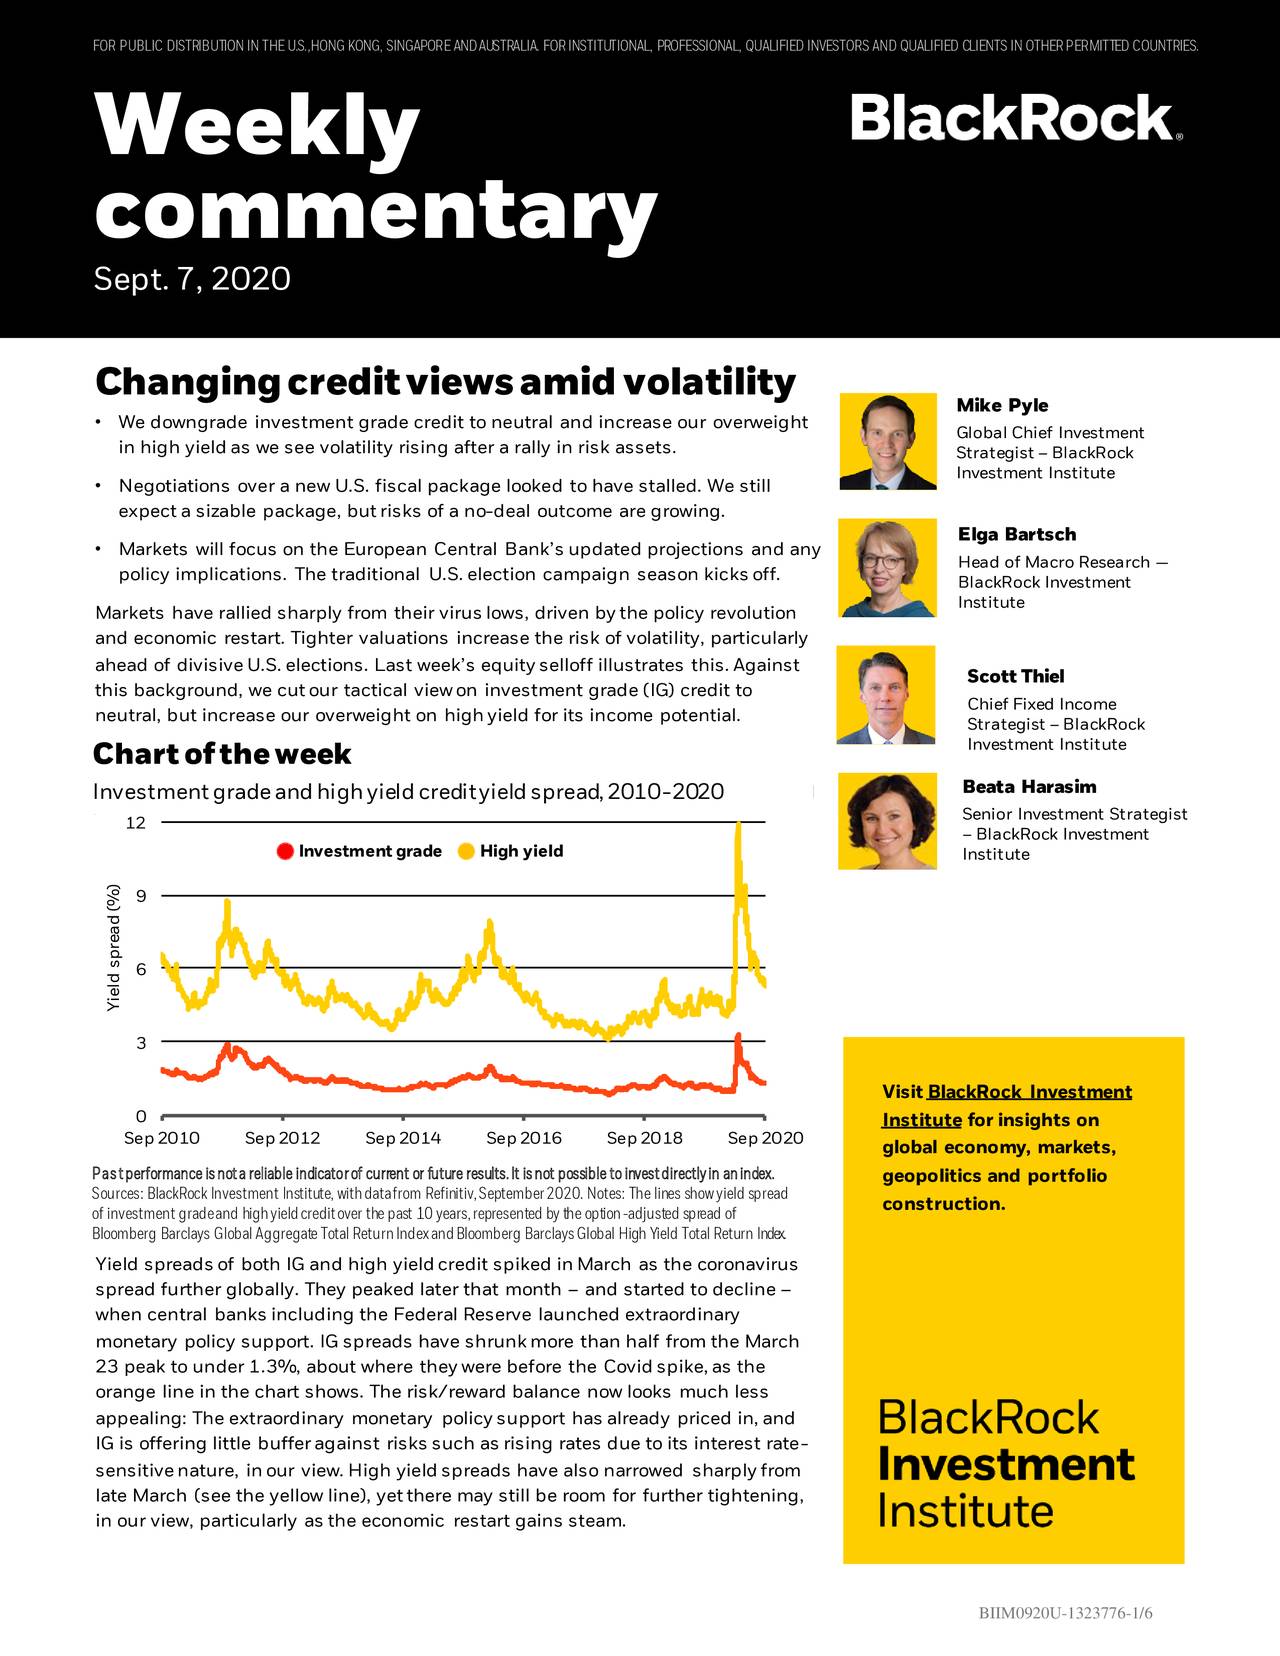
Changing Credit Views Amid Volatility
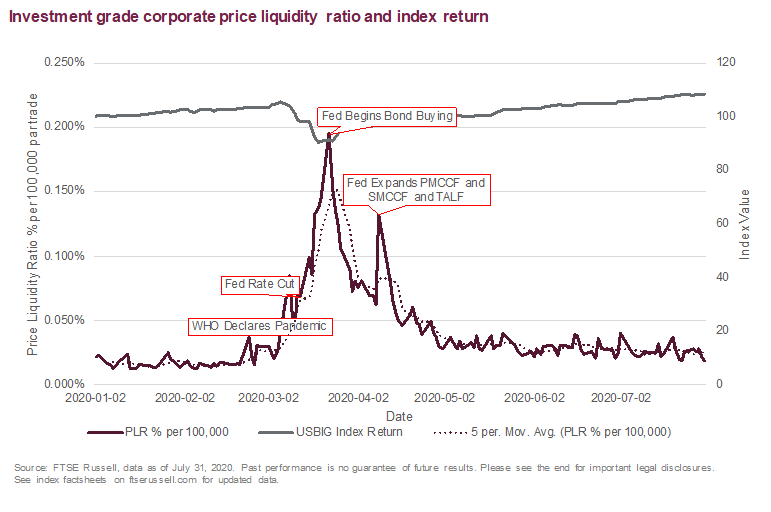
Crisis? What Crisis? USD Corporate Bond Liquidity Since COVID

BlackRock Debt Strategies Fund, Inc. (NYSE:DSU) Shares Acquired by Envestnet Asset Management Inc.
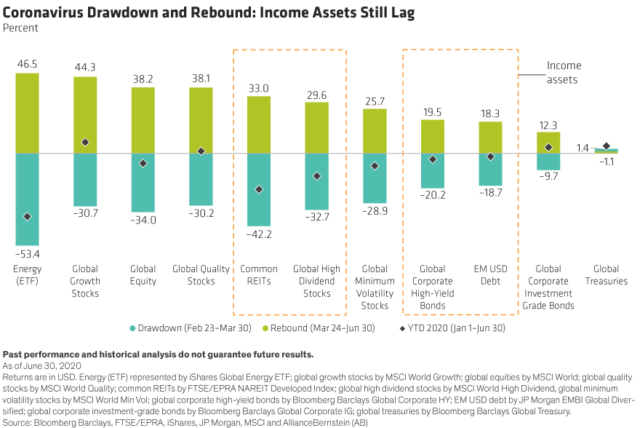
Income Assets Are Down But Not Out
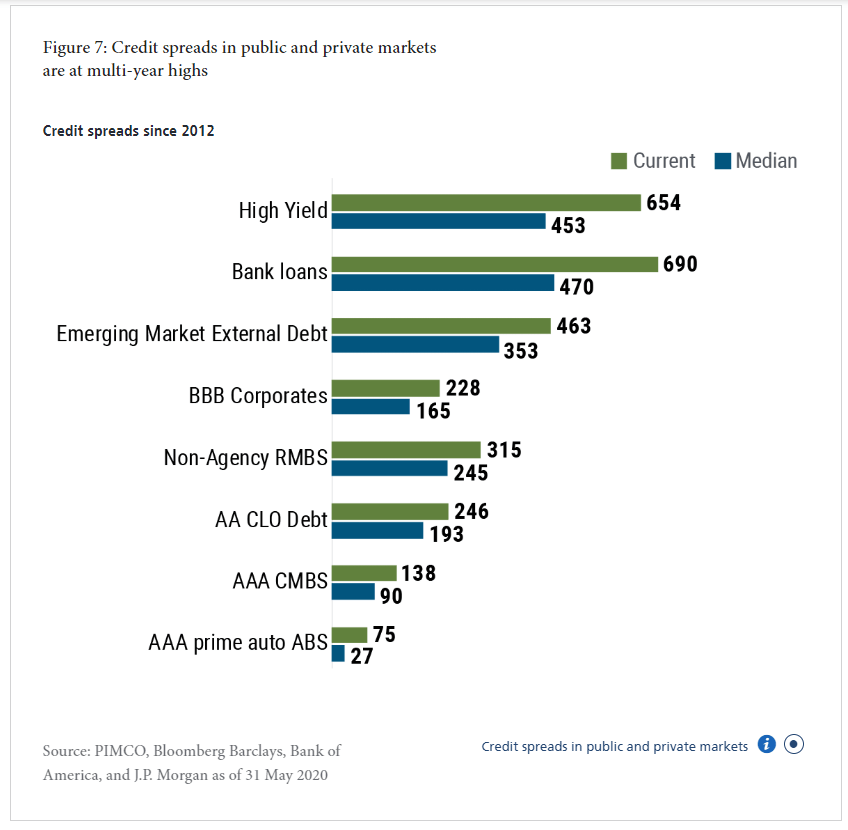
Corporate Credit Markets Remain In Good Shape

BlackRock Debt Strategies Fund, Inc. (NYSE:DSU) Plans $0.07 Monthly Dividend
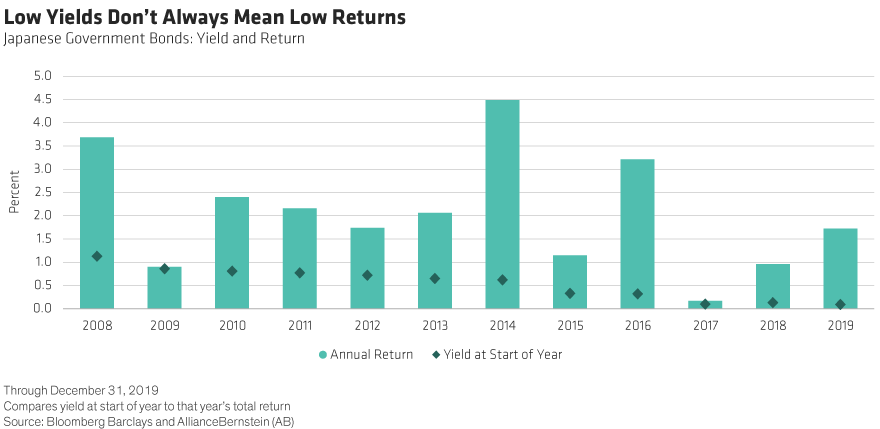
Midyear Outlook: Bond Investing In The Era Of Low And No Yield

The Chemist's 'High-High-Low' Closed-End Fund Report: June 2020
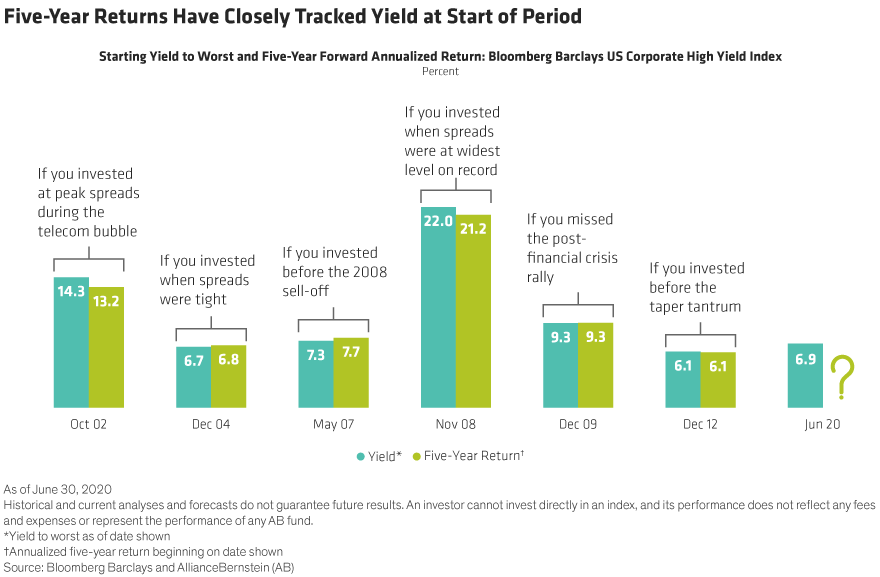
The One Metric All High-Yield Investors Should Know
Source: https://incomestatements.info
Category: Stock Reports
