Complete financial analysis of Dover Motorsports, Inc. (DVD) income statement, including revenue, profit margins, EPS and key performance metrics. Get detailed insights into the financial performance of Dover Motorsports, Inc., a leading company in the Leisure industry within the Consumer Cyclical sector.
- Macroblock, Inc. (3527.TWO) Income Statement Analysis – Financial Results
- Mo-BRUK S.A. (MBR.WA) Income Statement Analysis – Financial Results
- Monex Group, Inc. (MNXBF) Income Statement Analysis – Financial Results
- Gladstone Investment Corporation 4.875% Notes due 2028 (GAINZ) Income Statement Analysis – Financial Results
- NSC Groupe SA (ALNSC.PA) Income Statement Analysis – Financial Results
Dover Motorsports, Inc. (DVD)
About Dover Motorsports, Inc.
Dover Motorsports, Inc. markets and promotes motorsports entertainment in the United States. It owns and operates Dover International Speedway in Dover, Delaware; and Nashville Superspeedway near Nashville, Tennessee. The company was formerly known as Dover Downs Entertainment, Inc. Dover Motorsports, Inc. was founded in 1969 and is based in Dover, Delaware.
| Metric | 2020 | 2019 | 2018 | 2017 | 2016 | 2015 | 2014 | 2013 | 2012 | 2011 | 2010 | 2009 | 2008 | 2007 | 2006 | 2005 | 2004 | 2003 | 2002 | 2001 | 2000 | 1999 | 1998 | 1997 |
|---|---|---|---|---|---|---|---|---|---|---|---|---|---|---|---|---|---|---|---|---|---|---|---|---|
| Revenue | 38.54M | 45.96M | 47.02M | 46.74M | 45.87M | 46.54M | 45.67M | 46.18M | 46.75M | 51.87M | 62.96M | 70.88M | 84.28M | 86.05M | 91.27M | 91.00M | 93.62M | 93.63M | 93.73M | 86.55M | 245.87M | 207.90M | 140.90M | 101.70M |
| Cost of Revenue | 0.00 | 0.00 | 0.00 | 0.00 | 0.00 | 0.00 | 0.00 | 0.00 | 0.00 | 31.93M | 52.74M | 50.47M | 55.26M | 55.62M | 54.18M | 52.79M | 59.39M | 65.82M | 61.06M | 50.88M | 169.84M | 142.50M | 96.90M | 68.60M |
| Gross Profit | 38.54M | 45.96M | 47.02M | 46.74M | 45.87M | 46.54M | 45.67M | 46.18M | 46.75M | 19.94M | 10.22M | 20.41M | 29.02M | 30.43M | 37.10M | 38.21M | 34.23M | 27.80M | 32.67M | 35.67M | 76.03M | 65.40M | 44.00M | 33.10M |
| Gross Profit Ratio | 100.00% | 100.00% | 100.00% | 100.00% | 100.00% | 100.00% | 100.00% | 100.00% | 100.00% | 38.45% | 16.24% | 28.80% | 34.43% | 35.36% | 40.64% | 41.99% | 36.56% | 29.69% | 34.85% | 41.21% | 30.92% | 31.46% | 31.23% | 32.55% |
| Research & Development | 0.00 | 0.00 | 0.00 | 0.00 | 0.00 | 0.00 | 0.00 | 0.00 | 0.00 | 0.00 | 0.00 | 0.00 | 0.00 | 0.00 | 0.00 | 0.00 | 0.00 | 0.00 | 0.00 | 0.00 | 0.00 | 0.00 | 0.00 | 0.00 |
| General & Administrative | 7.68M | 7.52M | 7.31M | 7.31M | 7.40M | 7.41M | 7.15M | 7.25M | 7.56M | 0.00 | 0.00 | 0.00 | 0.00 | 0.00 | 0.00 | 0.00 | 0.00 | 0.00 | 0.00 | 11.41M | 0.00 | 11.20M | 4.40M | 3.10M |
| Selling & Marketing | 0.00 | 0.00 | 0.00 | 0.00 | 0.00 | 0.00 | 0.00 | 0.00 | 0.00 | 0.00 | 0.00 | 0.00 | 0.00 | 0.00 | 0.00 | 0.00 | 0.00 | 0.00 | 0.00 | 0.00 | 0.00 | 0.00 | 0.00 | 0.00 |
| SG&A | 7.68M | 7.52M | 7.31M | 7.31M | 7.40M | 7.41M | 7.15M | 7.25M | 7.56M | 0.00 | 0.00 | 0.00 | 0.00 | 0.00 | 0.00 | 0.00 | 0.00 | 0.00 | 0.00 | 11.41M | 0.00 | 11.20M | 4.40M | 3.10M |
| Other Expenses | 28.10M | 34.60M | 32.99M | 32.49M | 31.71M | 33.06M | 30.40M | 29.85M | 29.68M | 12.92M | 19.44M | 18.64M | 19.44M | 18.94M | 85.97M | 23.13M | 25.05M | 47.08M | 25.90M | 10.02M | 20.42M | 7.10M | 2.70M | 2.10M |
| Operating Expenses | 35.77M | 42.12M | 40.30M | 39.80M | 39.10M | 40.47M | 37.55M | 37.10M | 37.24M | 12.92M | 19.44M | 18.64M | 19.44M | 18.94M | 85.97M | 23.13M | 25.05M | 47.08M | 25.90M | 21.43M | 20.42M | 18.30M | 7.10M | 5.20M |
| Cost & Expenses | 35.77M | 42.12M | 40.30M | 39.80M | 39.10M | 40.47M | 37.55M | 37.10M | 37.24M | 44.84M | 72.18M | 69.11M | 74.70M | 74.56M | 140.15M | 75.92M | 84.44M | 112.90M | 86.96M | 72.31M | 190.26M | 160.80M | 104.00M | 73.80M |
| Interest Income | 0.00 | 0.00 | 0.00 | 0.00 | 0.00 | 0.00 | 0.00 | 0.00 | 0.00 | 0.00 | 17.00K | 14.00K | 83.00K | 0.00 | 0.00 | 0.00 | 0.00 | 0.00 | 53.00K | 107.00K | 0.00 | 0.00 | 0.00 | 0.00 |
| Interest Expense | 0.00 | 0.00 | 0.00 | 0.00 | 0.00 | 0.00 | 0.00 | 0.00 | 0.00 | 2.25M | 2.48M | 2.12M | 4.08M | 0.00 | 0.00 | 601.00K | 0.00 | -80.00K | 4.56M | 1.72M | 0.00 | 0.00 | 0.00 | 0.00 |
| Depreciation & Amortization | 3.05M | 4.35M | 3.29M | 3.57M | 3.43M | 5.33M | 3.26M | 3.29M | 3.31M | 4.59M | 6.19M | 6.47M | 6.91M | 6.55M | 8.91M | 9.80M | 9.96M | 11.76M | 9.79M | 10.02M | 8.47M | 7.10M | 2.70M | 2.10M |
| EBITDA | 10.47M | 11.64M | 12.35M | 10.10M | 9.82M | 13.93M | 8.54M | 7.24M | 11.38M | -6.45M | -2.82M | 682.00K | 3.78M | 13.89M | -43.93M | 18.79M | 15.71M | -12.69M | -7.52M | 45.46M | 62.94M | 52.90M | 40.30M | 30.40M |
| EBITDA Ratio | 27.15% | 25.32% | 26.27% | 21.61% | 21.41% | 29.92% | 18.70% | 15.68% | 24.34% | -12.43% | -4.48% | 0.96% | 4.48% | 16.15% | -48.12% | 20.65% | 16.78% | -13.55% | -8.02% | 52.53% | 25.60% | 25.44% | 28.60% | 29.89% |
| Operating Income | 7.42M | 7.29M | 9.07M | 6.54M | 6.39M | 8.60M | 5.28M | 3.95M | 8.06M | -11.03M | -9.01M | -5.79M | -3.13M | 7.34M | -52.84M | 8.99M | 5.75M | -24.44M | -17.31M | 35.44M | 54.47M | 45.80M | 37.60M | 28.30M |
| Operating Income Ratio | 19.25% | 15.85% | 19.28% | 13.99% | 13.93% | 18.48% | 11.56% | 8.55% | 17.25% | -21.27% | -14.31% | -8.16% | -3.72% | 8.53% | -57.89% | 9.88% | 6.14% | -26.11% | -18.46% | 40.95% | 22.15% | 22.03% | 26.69% | 27.83% |
| Total Other Income/Expenses | 0.00 | 0.00 | 0.00 | 0.00 | 0.00 | 0.00 | 0.00 | 0.00 | 0.00 | -2.17M | -2.48M | -2.12M | -4.08M | 0.00 | 0.00 | -601.00K | 0.00 | 80.00K | 19.57M | -22.82M | 0.00 | 0.00 | 0.00 | 0.00 |
| Income Before Tax | 7.42M | 7.29M | 9.07M | 6.54M | 6.39M | 8.60M | 5.28M | 3.95M | 8.06M | -13.21M | -11.49M | -7.91M | -7.21M | 7.34M | -52.84M | 8.39M | 5.75M | -24.36M | 2.26M | 12.62M | 54.47M | 45.80M | 37.60M | 28.30M |
| Income Before Tax Ratio | 19.25% | 15.85% | 19.28% | 13.99% | 13.93% | 18.48% | 11.56% | 8.55% | 17.25% | -25.46% | -18.24% | -11.16% | -8.55% | 8.53% | -57.89% | 9.22% | 6.14% | -26.02% | 2.41% | 14.59% | 22.15% | 22.03% | 26.69% | 27.83% |
| Income Tax Expense | -62.00K | 1.79M | 2.18M | -1.89M | 2.59M | 3.31M | 2.14M | 1.93M | 3.49M | -4.09M | -3.31M | -2.01M | -1.53M | 3.60M | -17.49M | 4.41M | 3.31M | -2.23M | 852.00K | 5.75M | 22.55M | 18.90M | 15.70M | 11.80M |
| Net Income | 7.48M | 5.50M | 6.89M | 8.43M | 3.80M | 5.29M | 3.15M | 2.02M | 4.57M | -9.11M | -8.17M | -5.90M | -5.68M | 3.74M | -35.35M | 3.98M | 2.44M | -22.14M | 1.41M | 6.87M | 31.93M | 26.90M | 21.90M | 16.50M |
| Net Income Ratio | 19.41% | 11.97% | 14.65% | 18.03% | 8.29% | 11.36% | 6.89% | 4.38% | 9.78% | -17.57% | -12.98% | -8.32% | -6.74% | 4.35% | -38.72% | 4.37% | 2.61% | -23.65% | 1.51% | 7.94% | 12.98% | 12.94% | 15.54% | 16.22% |
| EPS | 0.21 | 0.15 | 0.19 | 0.23 | 0.10 | 0.15 | 0.09 | 0.06 | 0.13 | -0.25 | -0.23 | -0.16 | -0.16 | 0.10 | -0.98 | 0.10 | 0.06 | -0.56 | 0.04 | 0.18 | 0.88 | 0.76 | 0.72 | 0.54 |
| EPS Diluted | 0.21 | 0.15 | 0.19 | 0.23 | 0.10 | 0.15 | 0.09 | 0.06 | 0.13 | -0.25 | -0.23 | -0.16 | -0.16 | 0.10 | -0.98 | 0.10 | 0.06 | -0.56 | 0.04 | 0.18 | 0.86 | 0.74 | 0.70 | 0.54 |
| Weighted Avg Shares Out | 35.84M | 35.95M | 36.13M | 36.28M | 36.23M | 36.16M | 36.05M | 36.25M | 36.30M | 36.19M | 36.10M | 36.02M | 35.94M | 37.44M | 36.07M | 38.13M | 40.67M | 39.68M | 38.51M | 37.79M | 36.48M | 35.57M | 30.49M | 30.45M |
| Weighted Avg Shares Out (Dil) | 35.84M | 35.95M | 36.13M | 36.28M | 36.23M | 36.16M | 36.05M | 36.25M | 36.30M | 36.19M | 36.10M | 36.02M | 35.94M | 37.44M | 36.07M | 38.13M | 40.67M | 39.68M | 39.17M | 38.31M | 37.33M | 36.59M | 31.21M | 30.45M |

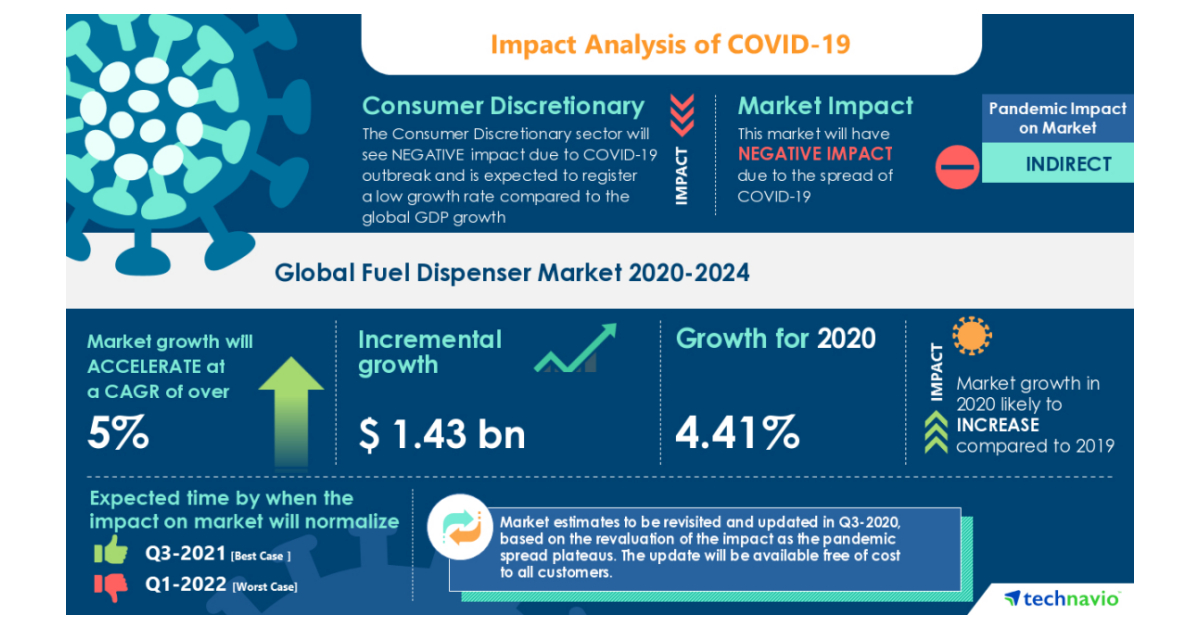
Fuel Dispenser Market Will Showcase Negative Impact During 2020-2024 | Increasing Inbound and Outbound Tourism to Boost Market Growth | Technavio

Fintech Focus For October 12, 2020

Joe Gibbs Wants Michael Jordan And Denny Hamlin To Follow In His Footsteps

Column: Job market rough for mid-level NASCAR drivers

TrueCar Leans into TrueCar Military with Dedicated Brand Marketing Campaign, “Drive On”

NASCAR's 2021 schedule includes a return to Sonoma Raceway in June

NASCAR back at Sonoma Raceway in 2021

NASCAR at long last adds schedule variety with 2021 changes

NASCAR at long last adds schedule variety with 2021 changes

Speedway Motorsports Brings NASCAR to Circuit of the Americas in 2021
Source: https://incomestatements.info
Category: Stock Reports
