Complete financial analysis of Dover Motorsports, Inc. (DVD) income statement, including revenue, profit margins, EPS and key performance metrics. Get detailed insights into the financial performance of Dover Motorsports, Inc., a leading company in the Leisure industry within the Consumer Cyclical sector.
- Sical Logistics Limited (SICALLOG.NS) Income Statement Analysis – Financial Results
- Keymed Biosciences Inc. (2162.HK) Income Statement Analysis – Financial Results
- Xali Gold Corp. (XGC.V) Income Statement Analysis – Financial Results
- Premium Exploration, Inc. (PMMEF) Income Statement Analysis – Financial Results
- Minnova Corp. (AGRDF) Income Statement Analysis – Financial Results
Dover Motorsports, Inc. (DVD)
About Dover Motorsports, Inc.
Dover Motorsports, Inc. markets and promotes motorsports entertainment in the United States. It owns and operates Dover International Speedway in Dover, Delaware; and Nashville Superspeedway near Nashville, Tennessee. The company was formerly known as Dover Downs Entertainment, Inc. Dover Motorsports, Inc. was founded in 1969 and is based in Dover, Delaware.
| Metric | 2020 | 2019 | 2018 | 2017 | 2016 | 2015 | 2014 | 2013 | 2012 | 2011 | 2010 | 2009 | 2008 | 2007 | 2006 | 2005 | 2004 | 2003 | 2002 | 2001 | 2000 | 1999 | 1998 | 1997 |
|---|---|---|---|---|---|---|---|---|---|---|---|---|---|---|---|---|---|---|---|---|---|---|---|---|
| Revenue | 38.54M | 45.96M | 47.02M | 46.74M | 45.87M | 46.54M | 45.67M | 46.18M | 46.75M | 51.87M | 62.96M | 70.88M | 84.28M | 86.05M | 91.27M | 91.00M | 93.62M | 93.63M | 93.73M | 86.55M | 245.87M | 207.90M | 140.90M | 101.70M |
| Cost of Revenue | 0.00 | 0.00 | 0.00 | 0.00 | 0.00 | 0.00 | 0.00 | 0.00 | 0.00 | 31.93M | 52.74M | 50.47M | 55.26M | 55.62M | 54.18M | 52.79M | 59.39M | 65.82M | 61.06M | 50.88M | 169.84M | 142.50M | 96.90M | 68.60M |
| Gross Profit | 38.54M | 45.96M | 47.02M | 46.74M | 45.87M | 46.54M | 45.67M | 46.18M | 46.75M | 19.94M | 10.22M | 20.41M | 29.02M | 30.43M | 37.10M | 38.21M | 34.23M | 27.80M | 32.67M | 35.67M | 76.03M | 65.40M | 44.00M | 33.10M |
| Gross Profit Ratio | 100.00% | 100.00% | 100.00% | 100.00% | 100.00% | 100.00% | 100.00% | 100.00% | 100.00% | 38.45% | 16.24% | 28.80% | 34.43% | 35.36% | 40.64% | 41.99% | 36.56% | 29.69% | 34.85% | 41.21% | 30.92% | 31.46% | 31.23% | 32.55% |
| Research & Development | 0.00 | 0.00 | 0.00 | 0.00 | 0.00 | 0.00 | 0.00 | 0.00 | 0.00 | 0.00 | 0.00 | 0.00 | 0.00 | 0.00 | 0.00 | 0.00 | 0.00 | 0.00 | 0.00 | 0.00 | 0.00 | 0.00 | 0.00 | 0.00 |
| General & Administrative | 7.68M | 7.52M | 7.31M | 7.31M | 7.40M | 7.41M | 7.15M | 7.25M | 7.56M | 0.00 | 0.00 | 0.00 | 0.00 | 0.00 | 0.00 | 0.00 | 0.00 | 0.00 | 0.00 | 11.41M | 0.00 | 11.20M | 4.40M | 3.10M |
| Selling & Marketing | 0.00 | 0.00 | 0.00 | 0.00 | 0.00 | 0.00 | 0.00 | 0.00 | 0.00 | 0.00 | 0.00 | 0.00 | 0.00 | 0.00 | 0.00 | 0.00 | 0.00 | 0.00 | 0.00 | 0.00 | 0.00 | 0.00 | 0.00 | 0.00 |
| SG&A | 7.68M | 7.52M | 7.31M | 7.31M | 7.40M | 7.41M | 7.15M | 7.25M | 7.56M | 0.00 | 0.00 | 0.00 | 0.00 | 0.00 | 0.00 | 0.00 | 0.00 | 0.00 | 0.00 | 11.41M | 0.00 | 11.20M | 4.40M | 3.10M |
| Other Expenses | 28.10M | 34.60M | 32.99M | 32.49M | 31.71M | 33.06M | 30.40M | 29.85M | 29.68M | 12.92M | 19.44M | 18.64M | 19.44M | 18.94M | 85.97M | 23.13M | 25.05M | 47.08M | 25.90M | 10.02M | 20.42M | 7.10M | 2.70M | 2.10M |
| Operating Expenses | 35.77M | 42.12M | 40.30M | 39.80M | 39.10M | 40.47M | 37.55M | 37.10M | 37.24M | 12.92M | 19.44M | 18.64M | 19.44M | 18.94M | 85.97M | 23.13M | 25.05M | 47.08M | 25.90M | 21.43M | 20.42M | 18.30M | 7.10M | 5.20M |
| Cost & Expenses | 35.77M | 42.12M | 40.30M | 39.80M | 39.10M | 40.47M | 37.55M | 37.10M | 37.24M | 44.84M | 72.18M | 69.11M | 74.70M | 74.56M | 140.15M | 75.92M | 84.44M | 112.90M | 86.96M | 72.31M | 190.26M | 160.80M | 104.00M | 73.80M |
| Interest Income | 0.00 | 0.00 | 0.00 | 0.00 | 0.00 | 0.00 | 0.00 | 0.00 | 0.00 | 0.00 | 17.00K | 14.00K | 83.00K | 0.00 | 0.00 | 0.00 | 0.00 | 0.00 | 53.00K | 107.00K | 0.00 | 0.00 | 0.00 | 0.00 |
| Interest Expense | 0.00 | 0.00 | 0.00 | 0.00 | 0.00 | 0.00 | 0.00 | 0.00 | 0.00 | 2.25M | 2.48M | 2.12M | 4.08M | 0.00 | 0.00 | 601.00K | 0.00 | -80.00K | 4.56M | 1.72M | 0.00 | 0.00 | 0.00 | 0.00 |
| Depreciation & Amortization | 3.05M | 4.35M | 3.29M | 3.57M | 3.43M | 5.33M | 3.26M | 3.29M | 3.31M | 4.59M | 6.19M | 6.47M | 6.91M | 6.55M | 8.91M | 9.80M | 9.96M | 11.76M | 9.79M | 10.02M | 8.47M | 7.10M | 2.70M | 2.10M |
| EBITDA | 10.47M | 11.64M | 12.35M | 10.10M | 9.82M | 13.93M | 8.54M | 7.24M | 11.38M | -6.45M | -2.82M | 682.00K | 3.78M | 13.89M | -43.93M | 18.79M | 15.71M | -12.69M | -7.52M | 45.46M | 62.94M | 52.90M | 40.30M | 30.40M |
| EBITDA Ratio | 27.15% | 25.32% | 26.27% | 21.61% | 21.41% | 29.92% | 18.70% | 15.68% | 24.34% | -12.43% | -4.48% | 0.96% | 4.48% | 16.15% | -48.12% | 20.65% | 16.78% | -13.55% | -8.02% | 52.53% | 25.60% | 25.44% | 28.60% | 29.89% |
| Operating Income | 7.42M | 7.29M | 9.07M | 6.54M | 6.39M | 8.60M | 5.28M | 3.95M | 8.06M | -11.03M | -9.01M | -5.79M | -3.13M | 7.34M | -52.84M | 8.99M | 5.75M | -24.44M | -17.31M | 35.44M | 54.47M | 45.80M | 37.60M | 28.30M |
| Operating Income Ratio | 19.25% | 15.85% | 19.28% | 13.99% | 13.93% | 18.48% | 11.56% | 8.55% | 17.25% | -21.27% | -14.31% | -8.16% | -3.72% | 8.53% | -57.89% | 9.88% | 6.14% | -26.11% | -18.46% | 40.95% | 22.15% | 22.03% | 26.69% | 27.83% |
| Total Other Income/Expenses | 0.00 | 0.00 | 0.00 | 0.00 | 0.00 | 0.00 | 0.00 | 0.00 | 0.00 | -2.17M | -2.48M | -2.12M | -4.08M | 0.00 | 0.00 | -601.00K | 0.00 | 80.00K | 19.57M | -22.82M | 0.00 | 0.00 | 0.00 | 0.00 |
| Income Before Tax | 7.42M | 7.29M | 9.07M | 6.54M | 6.39M | 8.60M | 5.28M | 3.95M | 8.06M | -13.21M | -11.49M | -7.91M | -7.21M | 7.34M | -52.84M | 8.39M | 5.75M | -24.36M | 2.26M | 12.62M | 54.47M | 45.80M | 37.60M | 28.30M |
| Income Before Tax Ratio | 19.25% | 15.85% | 19.28% | 13.99% | 13.93% | 18.48% | 11.56% | 8.55% | 17.25% | -25.46% | -18.24% | -11.16% | -8.55% | 8.53% | -57.89% | 9.22% | 6.14% | -26.02% | 2.41% | 14.59% | 22.15% | 22.03% | 26.69% | 27.83% |
| Income Tax Expense | -62.00K | 1.79M | 2.18M | -1.89M | 2.59M | 3.31M | 2.14M | 1.93M | 3.49M | -4.09M | -3.31M | -2.01M | -1.53M | 3.60M | -17.49M | 4.41M | 3.31M | -2.23M | 852.00K | 5.75M | 22.55M | 18.90M | 15.70M | 11.80M |
| Net Income | 7.48M | 5.50M | 6.89M | 8.43M | 3.80M | 5.29M | 3.15M | 2.02M | 4.57M | -9.11M | -8.17M | -5.90M | -5.68M | 3.74M | -35.35M | 3.98M | 2.44M | -22.14M | 1.41M | 6.87M | 31.93M | 26.90M | 21.90M | 16.50M |
| Net Income Ratio | 19.41% | 11.97% | 14.65% | 18.03% | 8.29% | 11.36% | 6.89% | 4.38% | 9.78% | -17.57% | -12.98% | -8.32% | -6.74% | 4.35% | -38.72% | 4.37% | 2.61% | -23.65% | 1.51% | 7.94% | 12.98% | 12.94% | 15.54% | 16.22% |
| EPS | 0.21 | 0.15 | 0.19 | 0.23 | 0.10 | 0.15 | 0.09 | 0.06 | 0.13 | -0.25 | -0.23 | -0.16 | -0.16 | 0.10 | -0.98 | 0.10 | 0.06 | -0.56 | 0.04 | 0.18 | 0.88 | 0.76 | 0.72 | 0.54 |
| EPS Diluted | 0.21 | 0.15 | 0.19 | 0.23 | 0.10 | 0.15 | 0.09 | 0.06 | 0.13 | -0.25 | -0.23 | -0.16 | -0.16 | 0.10 | -0.98 | 0.10 | 0.06 | -0.56 | 0.04 | 0.18 | 0.86 | 0.74 | 0.70 | 0.54 |
| Weighted Avg Shares Out | 35.84M | 35.95M | 36.13M | 36.28M | 36.23M | 36.16M | 36.05M | 36.25M | 36.30M | 36.19M | 36.10M | 36.02M | 35.94M | 37.44M | 36.07M | 38.13M | 40.67M | 39.68M | 38.51M | 37.79M | 36.48M | 35.57M | 30.49M | 30.45M |
| Weighted Avg Shares Out (Dil) | 35.84M | 35.95M | 36.13M | 36.28M | 36.23M | 36.16M | 36.05M | 36.25M | 36.30M | 36.19M | 36.10M | 36.02M | 35.94M | 37.44M | 36.07M | 38.13M | 40.67M | 39.68M | 39.17M | 38.31M | 37.33M | 36.59M | 31.21M | 30.45M |

No More Chicagoland Speedway NASCAR Racing Ever?

Column: Busch family hobby goes full circle at home in Vegas

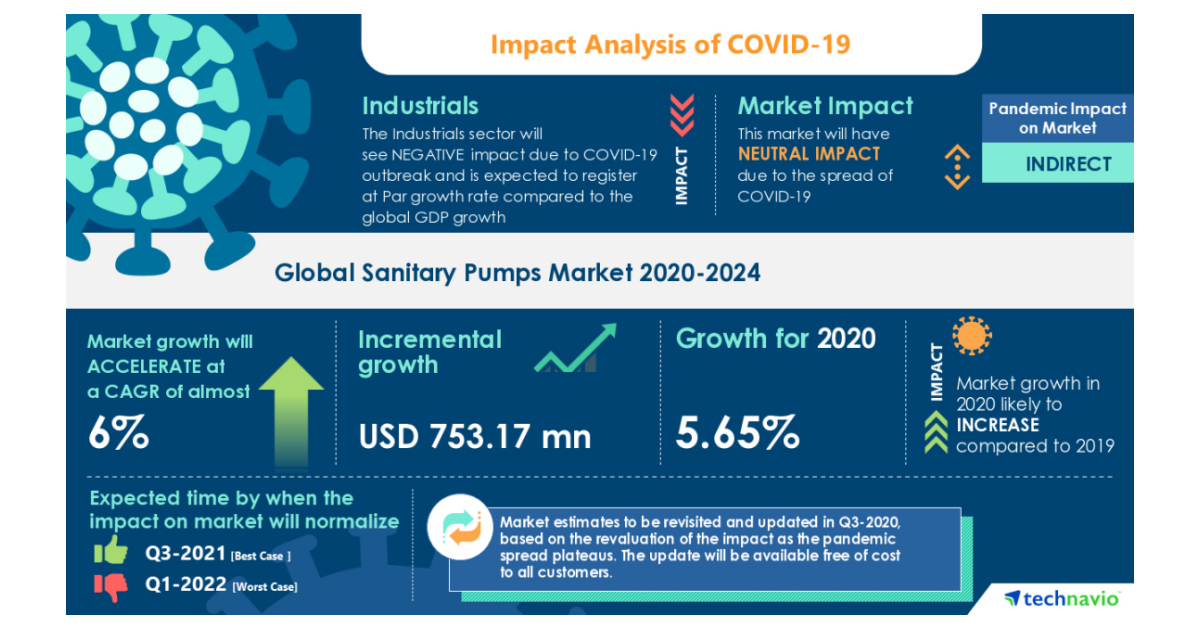
Sanitary Pumps Market- Roadmap for Recovery from COVID-19 | Growing Consolidation of Vendors to Boost Market Growth | Technavio

Marathon Petroleum Corp. to Announce 2020 Third-Quarter Financial Results Nov. 2

Marathon Petroleum Corp. and MPLX LP announce redemption of outstanding senior notes

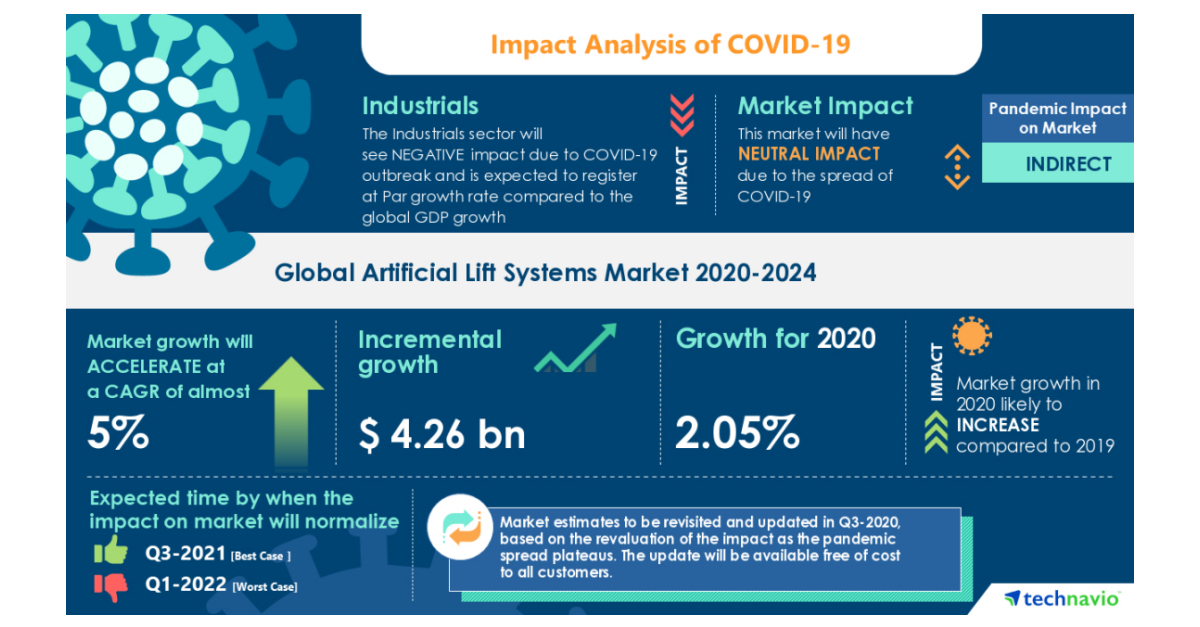
COVID-19 Recovery Analysis: Artificial Lift Systems Market | Growing Demand for Oil and Natural Gas to Boost the Market Growth | Technavio

Michael Jordan and Bubba Wallace's new NASCAR team could be the sport's 'Tiger Woods' moment

Michael Jordan buys spot to form NASCAR team, hires Bubba Wallace

Michael Jordan And Denny Hamlin, Bubba Wallace Form NASCAR Team

Hamlin, Michael Jordan partner on NASCAR team for Wallace
Source: https://incomestatements.info
Category: Stock Reports
