See more : Forrestania Resources Limited (FRS.AX) Income Statement Analysis – Financial Results
Complete financial analysis of Dover Motorsports, Inc. (DVD) income statement, including revenue, profit margins, EPS and key performance metrics. Get detailed insights into the financial performance of Dover Motorsports, Inc., a leading company in the Leisure industry within the Consumer Cyclical sector.
- Create Medic Co., Ltd. (5187.T) Income Statement Analysis – Financial Results
- Zimmer Energy Transition Acquisition Corp. (ZTAQU) Income Statement Analysis – Financial Results
- Kip McGrath Education Centres Limited (KME.AX) Income Statement Analysis – Financial Results
- Audio Pixels Holdings Limited (AKP.AX) Income Statement Analysis – Financial Results
- My Size, Inc. (MYSZ) Income Statement Analysis – Financial Results
Dover Motorsports, Inc. (DVD)
About Dover Motorsports, Inc.
Dover Motorsports, Inc. markets and promotes motorsports entertainment in the United States. It owns and operates Dover International Speedway in Dover, Delaware; and Nashville Superspeedway near Nashville, Tennessee. The company was formerly known as Dover Downs Entertainment, Inc. Dover Motorsports, Inc. was founded in 1969 and is based in Dover, Delaware.
| Metric | 2020 | 2019 | 2018 | 2017 | 2016 | 2015 | 2014 | 2013 | 2012 | 2011 | 2010 | 2009 | 2008 | 2007 | 2006 | 2005 | 2004 | 2003 | 2002 | 2001 | 2000 | 1999 | 1998 | 1997 |
|---|---|---|---|---|---|---|---|---|---|---|---|---|---|---|---|---|---|---|---|---|---|---|---|---|
| Revenue | 38.54M | 45.96M | 47.02M | 46.74M | 45.87M | 46.54M | 45.67M | 46.18M | 46.75M | 51.87M | 62.96M | 70.88M | 84.28M | 86.05M | 91.27M | 91.00M | 93.62M | 93.63M | 93.73M | 86.55M | 245.87M | 207.90M | 140.90M | 101.70M |
| Cost of Revenue | 0.00 | 0.00 | 0.00 | 0.00 | 0.00 | 0.00 | 0.00 | 0.00 | 0.00 | 31.93M | 52.74M | 50.47M | 55.26M | 55.62M | 54.18M | 52.79M | 59.39M | 65.82M | 61.06M | 50.88M | 169.84M | 142.50M | 96.90M | 68.60M |
| Gross Profit | 38.54M | 45.96M | 47.02M | 46.74M | 45.87M | 46.54M | 45.67M | 46.18M | 46.75M | 19.94M | 10.22M | 20.41M | 29.02M | 30.43M | 37.10M | 38.21M | 34.23M | 27.80M | 32.67M | 35.67M | 76.03M | 65.40M | 44.00M | 33.10M |
| Gross Profit Ratio | 100.00% | 100.00% | 100.00% | 100.00% | 100.00% | 100.00% | 100.00% | 100.00% | 100.00% | 38.45% | 16.24% | 28.80% | 34.43% | 35.36% | 40.64% | 41.99% | 36.56% | 29.69% | 34.85% | 41.21% | 30.92% | 31.46% | 31.23% | 32.55% |
| Research & Development | 0.00 | 0.00 | 0.00 | 0.00 | 0.00 | 0.00 | 0.00 | 0.00 | 0.00 | 0.00 | 0.00 | 0.00 | 0.00 | 0.00 | 0.00 | 0.00 | 0.00 | 0.00 | 0.00 | 0.00 | 0.00 | 0.00 | 0.00 | 0.00 |
| General & Administrative | 7.68M | 7.52M | 7.31M | 7.31M | 7.40M | 7.41M | 7.15M | 7.25M | 7.56M | 0.00 | 0.00 | 0.00 | 0.00 | 0.00 | 0.00 | 0.00 | 0.00 | 0.00 | 0.00 | 11.41M | 0.00 | 11.20M | 4.40M | 3.10M |
| Selling & Marketing | 0.00 | 0.00 | 0.00 | 0.00 | 0.00 | 0.00 | 0.00 | 0.00 | 0.00 | 0.00 | 0.00 | 0.00 | 0.00 | 0.00 | 0.00 | 0.00 | 0.00 | 0.00 | 0.00 | 0.00 | 0.00 | 0.00 | 0.00 | 0.00 |
| SG&A | 7.68M | 7.52M | 7.31M | 7.31M | 7.40M | 7.41M | 7.15M | 7.25M | 7.56M | 0.00 | 0.00 | 0.00 | 0.00 | 0.00 | 0.00 | 0.00 | 0.00 | 0.00 | 0.00 | 11.41M | 0.00 | 11.20M | 4.40M | 3.10M |
| Other Expenses | 28.10M | 34.60M | 32.99M | 32.49M | 31.71M | 33.06M | 30.40M | 29.85M | 29.68M | 12.92M | 19.44M | 18.64M | 19.44M | 18.94M | 85.97M | 23.13M | 25.05M | 47.08M | 25.90M | 10.02M | 20.42M | 7.10M | 2.70M | 2.10M |
| Operating Expenses | 35.77M | 42.12M | 40.30M | 39.80M | 39.10M | 40.47M | 37.55M | 37.10M | 37.24M | 12.92M | 19.44M | 18.64M | 19.44M | 18.94M | 85.97M | 23.13M | 25.05M | 47.08M | 25.90M | 21.43M | 20.42M | 18.30M | 7.10M | 5.20M |
| Cost & Expenses | 35.77M | 42.12M | 40.30M | 39.80M | 39.10M | 40.47M | 37.55M | 37.10M | 37.24M | 44.84M | 72.18M | 69.11M | 74.70M | 74.56M | 140.15M | 75.92M | 84.44M | 112.90M | 86.96M | 72.31M | 190.26M | 160.80M | 104.00M | 73.80M |
| Interest Income | 0.00 | 0.00 | 0.00 | 0.00 | 0.00 | 0.00 | 0.00 | 0.00 | 0.00 | 0.00 | 17.00K | 14.00K | 83.00K | 0.00 | 0.00 | 0.00 | 0.00 | 0.00 | 53.00K | 107.00K | 0.00 | 0.00 | 0.00 | 0.00 |
| Interest Expense | 0.00 | 0.00 | 0.00 | 0.00 | 0.00 | 0.00 | 0.00 | 0.00 | 0.00 | 2.25M | 2.48M | 2.12M | 4.08M | 0.00 | 0.00 | 601.00K | 0.00 | -80.00K | 4.56M | 1.72M | 0.00 | 0.00 | 0.00 | 0.00 |
| Depreciation & Amortization | 3.05M | 4.35M | 3.29M | 3.57M | 3.43M | 5.33M | 3.26M | 3.29M | 3.31M | 4.59M | 6.19M | 6.47M | 6.91M | 6.55M | 8.91M | 9.80M | 9.96M | 11.76M | 9.79M | 10.02M | 8.47M | 7.10M | 2.70M | 2.10M |
| EBITDA | 10.47M | 11.64M | 12.35M | 10.10M | 9.82M | 13.93M | 8.54M | 7.24M | 11.38M | -6.45M | -2.82M | 682.00K | 3.78M | 13.89M | -43.93M | 18.79M | 15.71M | -12.69M | -7.52M | 45.46M | 62.94M | 52.90M | 40.30M | 30.40M |
| EBITDA Ratio | 27.15% | 25.32% | 26.27% | 21.61% | 21.41% | 29.92% | 18.70% | 15.68% | 24.34% | -12.43% | -4.48% | 0.96% | 4.48% | 16.15% | -48.12% | 20.65% | 16.78% | -13.55% | -8.02% | 52.53% | 25.60% | 25.44% | 28.60% | 29.89% |
| Operating Income | 7.42M | 7.29M | 9.07M | 6.54M | 6.39M | 8.60M | 5.28M | 3.95M | 8.06M | -11.03M | -9.01M | -5.79M | -3.13M | 7.34M | -52.84M | 8.99M | 5.75M | -24.44M | -17.31M | 35.44M | 54.47M | 45.80M | 37.60M | 28.30M |
| Operating Income Ratio | 19.25% | 15.85% | 19.28% | 13.99% | 13.93% | 18.48% | 11.56% | 8.55% | 17.25% | -21.27% | -14.31% | -8.16% | -3.72% | 8.53% | -57.89% | 9.88% | 6.14% | -26.11% | -18.46% | 40.95% | 22.15% | 22.03% | 26.69% | 27.83% |
| Total Other Income/Expenses | 0.00 | 0.00 | 0.00 | 0.00 | 0.00 | 0.00 | 0.00 | 0.00 | 0.00 | -2.17M | -2.48M | -2.12M | -4.08M | 0.00 | 0.00 | -601.00K | 0.00 | 80.00K | 19.57M | -22.82M | 0.00 | 0.00 | 0.00 | 0.00 |
| Income Before Tax | 7.42M | 7.29M | 9.07M | 6.54M | 6.39M | 8.60M | 5.28M | 3.95M | 8.06M | -13.21M | -11.49M | -7.91M | -7.21M | 7.34M | -52.84M | 8.39M | 5.75M | -24.36M | 2.26M | 12.62M | 54.47M | 45.80M | 37.60M | 28.30M |
| Income Before Tax Ratio | 19.25% | 15.85% | 19.28% | 13.99% | 13.93% | 18.48% | 11.56% | 8.55% | 17.25% | -25.46% | -18.24% | -11.16% | -8.55% | 8.53% | -57.89% | 9.22% | 6.14% | -26.02% | 2.41% | 14.59% | 22.15% | 22.03% | 26.69% | 27.83% |
| Income Tax Expense | -62.00K | 1.79M | 2.18M | -1.89M | 2.59M | 3.31M | 2.14M | 1.93M | 3.49M | -4.09M | -3.31M | -2.01M | -1.53M | 3.60M | -17.49M | 4.41M | 3.31M | -2.23M | 852.00K | 5.75M | 22.55M | 18.90M | 15.70M | 11.80M |
| Net Income | 7.48M | 5.50M | 6.89M | 8.43M | 3.80M | 5.29M | 3.15M | 2.02M | 4.57M | -9.11M | -8.17M | -5.90M | -5.68M | 3.74M | -35.35M | 3.98M | 2.44M | -22.14M | 1.41M | 6.87M | 31.93M | 26.90M | 21.90M | 16.50M |
| Net Income Ratio | 19.41% | 11.97% | 14.65% | 18.03% | 8.29% | 11.36% | 6.89% | 4.38% | 9.78% | -17.57% | -12.98% | -8.32% | -6.74% | 4.35% | -38.72% | 4.37% | 2.61% | -23.65% | 1.51% | 7.94% | 12.98% | 12.94% | 15.54% | 16.22% |
| EPS | 0.21 | 0.15 | 0.19 | 0.23 | 0.10 | 0.15 | 0.09 | 0.06 | 0.13 | -0.25 | -0.23 | -0.16 | -0.16 | 0.10 | -0.98 | 0.10 | 0.06 | -0.56 | 0.04 | 0.18 | 0.88 | 0.76 | 0.72 | 0.54 |
| EPS Diluted | 0.21 | 0.15 | 0.19 | 0.23 | 0.10 | 0.15 | 0.09 | 0.06 | 0.13 | -0.25 | -0.23 | -0.16 | -0.16 | 0.10 | -0.98 | 0.10 | 0.06 | -0.56 | 0.04 | 0.18 | 0.86 | 0.74 | 0.70 | 0.54 |
| Weighted Avg Shares Out | 35.84M | 35.95M | 36.13M | 36.28M | 36.23M | 36.16M | 36.05M | 36.25M | 36.30M | 36.19M | 36.10M | 36.02M | 35.94M | 37.44M | 36.07M | 38.13M | 40.67M | 39.68M | 38.51M | 37.79M | 36.48M | 35.57M | 30.49M | 30.45M |
| Weighted Avg Shares Out (Dil) | 35.84M | 35.95M | 36.13M | 36.28M | 36.23M | 36.16M | 36.05M | 36.25M | 36.30M | 36.19M | 36.10M | 36.02M | 35.94M | 37.44M | 36.07M | 38.13M | 40.67M | 39.68M | 39.17M | 38.31M | 37.33M | 36.59M | 31.21M | 30.45M |
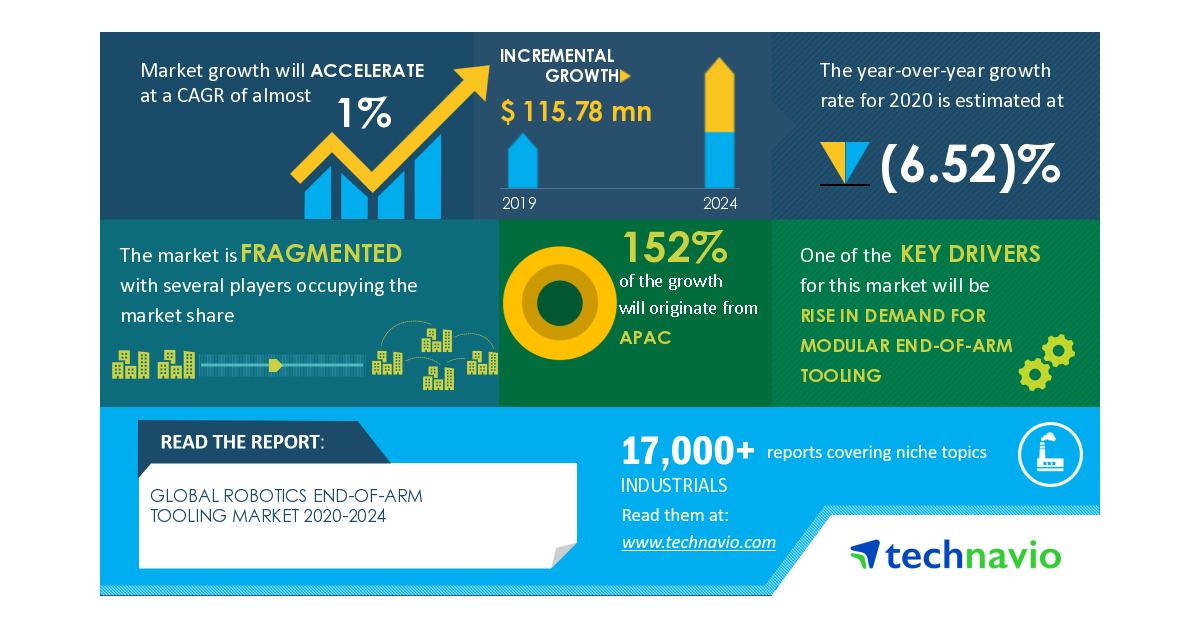
Global Robotics End-of-Arm Tooling Market: COVID-19 Business Continuity Plan | Evolving Opportunities with Applied Robotics Inc. and ASS Maschinenbau GmbH | Technavio
AdvisorNet Financial Inc Raises Holdings in Dover Corp (NYSE:DOV)
Oppenheimer Weighs in on Dover Corp’s Q4 2020 Earnings (NYSE:DOV)
Stifel Financial Corp Boosts Holdings in Dover Corp (NYSE:DOV)

Racing Roundup: ‘Senior movement’ not good for the sport

BRP fait équipe avec le pilote québécois de NASCAR Alex Labbé

Fox Corporation Is A Recovery Buy

Wallace leaving Richard Petty Motorsports at end of NASCAR season

NASCAR races, Wallace says fight for racial equality goes on
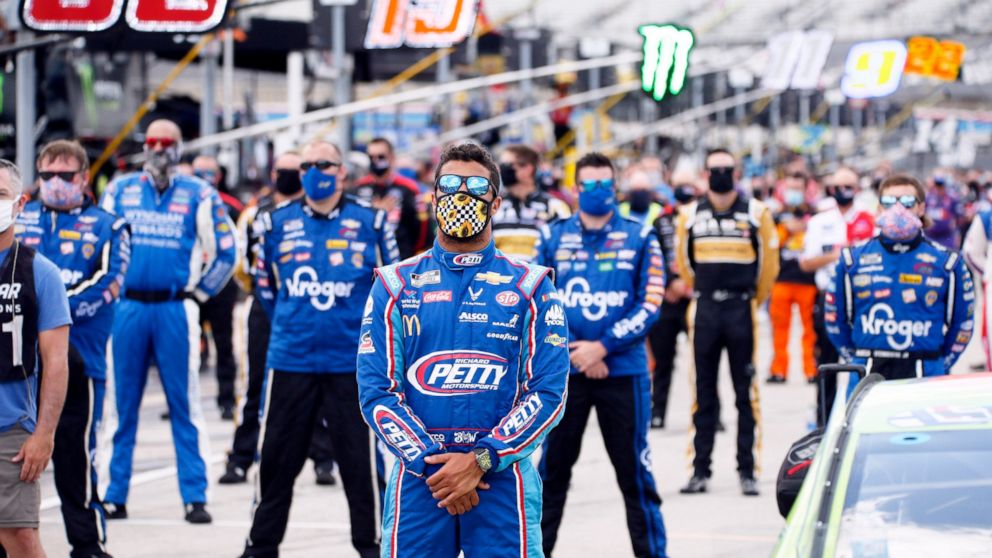
NASCAR races, Wallace says fight for racial equality goes on
Source: https://incomestatements.info
Category: Stock Reports
