See more : Fletcher Building Limited (FRCEF) Income Statement Analysis – Financial Results
Complete financial analysis of Eagle Bancorp Montana, Inc. (EBMT) income statement, including revenue, profit margins, EPS and key performance metrics. Get detailed insights into the financial performance of Eagle Bancorp Montana, Inc., a leading company in the Banks – Regional industry within the Financial Services sector.
- Advanced Info Service Public Company Limited (ADVANC-R.BK) Income Statement Analysis – Financial Results
- Wizz Air Holdings Plc (WZZZY) Income Statement Analysis – Financial Results
- Changzhou Tiansheng New Materials Co., Ltd. (300169.SZ) Income Statement Analysis – Financial Results
- Sandbridge X2 Corp. (SBII) Income Statement Analysis – Financial Results
- NSE S.A. (ALNSE.PA) Income Statement Analysis – Financial Results
Eagle Bancorp Montana, Inc. (EBMT)
About Eagle Bancorp Montana, Inc.
Eagle Bancorp Montana, Inc. operates as the bank holding company for Opportunity Bank of Montana that provides various retail banking products and services to small businesses and individuals in Montana. It accepts various deposit products, such as checking, savings, money market, and individual retirement accounts, as well as certificates of deposit accounts. The company also provides 1-4 family residential mortgage loans, such as residential mortgages and construction of residential properties; commercial real estate loans, including multi-family dwellings, nonresidential property, commercial construction and development, and farmland loans; and second mortgage/home equity loans. In addition, it offers consumer loans, such as loans secured by collateral other than real estate, such as automobiles, recreational vehicles, and boats; personal loans and lines of credit; commercial business loans consisting of business loans and lines of credit on a secured and unsecured basis; construction loans; agricultural loans; and mortgage loan services. The company operates 23 full-service branches, 1 community banking office, and 25 automated teller machines. Eagle Bancorp Montana, Inc. was founded in 1922 and is headquartered in Helena, Montana.
| Metric | 2023 | 2022 | 2021 | 2020 | 2019 | 2018 | 2017 | 2016 | 2015 | 2014 | 2013 | 2012 | 2011 | 2010 | 2009 |
|---|---|---|---|---|---|---|---|---|---|---|---|---|---|---|---|
| Revenue | 83.74M | 4.28M | 91.57M | 90.35M | 61.60M | 42.43M | 38.10M | 36.78M | 29.77M | 25.28M | 22.87M | 15.11M | 15.50M | 13.40M | 12.23M |
| Cost of Revenue | 0.00 | 0.00 | 0.00 | 0.00 | 0.00 | 0.00 | 0.00 | 0.00 | 0.00 | 0.00 | 0.00 | 0.00 | 0.00 | 0.00 | 0.00 |
| Gross Profit | 83.74M | 4.28M | 91.57M | 90.35M | 61.60M | 42.43M | 38.10M | 36.78M | 29.77M | 25.28M | 22.87M | 15.11M | 15.50M | 13.40M | 12.23M |
| Gross Profit Ratio | 100.00% | 100.00% | 100.00% | 100.00% | 100.00% | 100.00% | 100.00% | 100.00% | 100.00% | 100.00% | 100.00% | 100.00% | 100.00% | 100.00% | 100.00% |
| Research & Development | 0.00 | 0.00 | 0.00 | 0.00 | 0.00 | 0.00 | 0.00 | 0.00 | 0.00 | 0.00 | 0.00 | 0.00 | 0.00 | 0.00 | 0.00 |
| General & Administrative | 44.12M | 45.08M | 54.52M | 44.14M | 31.73M | 24.24M | 20.62M | 18.86M | 17.12M | 15.14M | 12.07M | 6.86M | 6.44M | 5.73M | 5.28M |
| Selling & Marketing | 1.38M | 1.42M | 1.28M | 911.00K | 1.03M | 1.16M | 966.00K | 696.00K | 800.00K | 816.00K | 946.00K | 568.00K | 524.00K | 438.00K | 394.00K |
| SG&A | 45.50M | 46.50M | 55.80M | 45.05M | 32.75M | 25.39M | 21.59M | 19.56M | 17.92M | 15.95M | 13.02M | 7.43M | 6.96M | 6.16M | 5.67M |
| Other Expenses | 0.00 | -19.27M | -128.09M | -106.97M | -80.39M | -9.56M | -8.26M | -7.67M | 0.00 | 0.00 | 0.00 | 0.00 | 0.00 | 0.00 | 0.00 |
| Operating Expenses | 60.29M | 2.89M | -72.29M | -61.91M | -47.64M | 25.39M | 21.59M | 19.56M | 17.92M | 15.95M | 13.02M | 7.09M | 6.60M | 6.16M | 5.67M |
| Cost & Expenses | 83.31M | 2.89M | -72.29M | -61.91M | -47.64M | 25.39M | 21.59M | 19.56M | 17.92M | 15.95M | 13.02M | 7.09M | 6.60M | 6.16M | 5.67M |
| Interest Income | 90.89M | 69.16M | 49.49M | 49.28M | 46.10M | 34.52M | 27.69M | 23.77M | 20.40M | 17.28M | 14.80M | 14.09M | 14.95M | 14.91M | 15.35M |
| Interest Expense | 29.14M | 6.15M | 3.21M | 6.48M | 7.73M | 5.10M | 4.09M | 3.12M | 2.45M | 2.04M | 2.24M | 3.16M | 4.08M | 5.11M | 6.12M |
| Depreciation & Amortization | 0.00 | 5.59M | 4.12M | 3.57M | 2.60M | 1.98M | 1.40M | 1.50M | 1.23M | 1.06M | 1.11M | 629.00K | 1.16M | 1.14M | 1.08M |
| EBITDA | 0.00 | 0.00 | 0.00 | 42.42M | 19.33M | 0.00 | 9.80M | 10.93M | 5.21M | 2.30M | 0.00 | 0.00 | 0.00 | 8.06M | 7.53M |
| EBITDA Ratio | 0.00% | 647.51% | 21.68% | 32.21% | 24.43% | 33.42% | 33.61% | 34.80% | 25.73% | 23.77% | 24.55% | 49.81% | 60.98% | 72.36% | 86.72% |
| Operating Income | 1.76M | 26.37M | 19.28M | 28.44M | 13.97M | 11.00M | 10.33M | 10.05M | 5.20M | 3.81M | 3.57M | 6.14M | 7.55M | 8.55M | 9.53M |
| Operating Income Ratio | 2.10% | 616.34% | 21.06% | 31.48% | 22.67% | 25.92% | 27.10% | 27.32% | 17.46% | 15.06% | 15.61% | 40.62% | 48.74% | 63.86% | 77.89% |
| Total Other Income/Expenses | 9.89M | -12.68M | -9.30M | -9.48M | -7.89M | -5.72M | -5.85M | -5.45M | -4.05M | -2.05M | -2.25M | -5.30M | -985.00K | -5.11M | -6.12M |
| Income Before Tax | 11.65M | 13.85M | 19.28M | 28.44M | 13.97M | 5.90M | 6.23M | 6.93M | 2.74M | 1.76M | 1.32M | 2.97M | 3.47M | 3.45M | 3.41M |
| Income Before Tax Ratio | 13.92% | 323.63% | 21.06% | 31.48% | 22.67% | 13.89% | 16.36% | 18.84% | 9.21% | 6.97% | 5.79% | 19.66% | 22.37% | 25.75% | 27.89% |
| Income Tax Expense | 1.60M | 3.15M | 4.86M | 7.23M | 3.10M | 914.00K | 2.13M | 1.80M | 163.00K | -350.00K | -650.00K | 792.00K | 1.06M | 1.04M | 1.02M |
| Net Income | 10.06M | 10.70M | 14.42M | 21.21M | 10.87M | 4.98M | 4.10M | 5.13M | 2.58M | 2.11M | 1.97M | 2.18M | 2.41M | 2.41M | 2.39M |
| Net Income Ratio | 12.01% | 250.08% | 15.75% | 23.47% | 17.65% | 11.74% | 10.77% | 13.95% | 8.67% | 8.35% | 8.63% | 14.42% | 15.55% | 18.02% | 19.52% |
| EPS | 1.29 | 1.45 | 2.17 | 3.12 | 1.69 | 0.92 | 1.01 | 1.36 | 0.68 | 0.54 | 0.53 | 0.58 | 0.62 | 0.60 | 0.59 |
| EPS Diluted | 1.29 | 1.45 | 2.17 | 3.11 | 1.69 | 0.91 | 0.99 | 1.32 | 0.67 | 0.53 | 0.50 | 0.56 | 0.62 | 0.54 | 0.51 |
| Weighted Avg Shares Out | 7.79M | 7.38M | 6.65M | 6.80M | 6.42M | 5.43M | 4.07M | 3.78M | 3.81M | 3.91M | 3.74M | 3.73M | 3.89M | 4.04M | 4.07M |
| Weighted Avg Shares Out (Dil) | 7.80M | 7.39M | 6.66M | 6.82M | 6.44M | 5.49M | 4.13M | 3.87M | 3.86M | 3.97M | 3.94M | 3.90M | 3.90M | 4.47M | 4.64M |

Eagle Bancorp Montana Earns a Record $6.4 Million, or $0.94 per Diluted Share, in Third Quarter 2020; Declares Quarterly Cash Dividend of $0.0975 per Share

Dividend Champion And Contender Highlights: Week Of August 9

Dividend Champion And Contender Highlights: Week Of August 2

Advisor Group Holdings Inc. Buys New Shares in Eagle Bancorp, Inc. (NASDAQ:EGBN)
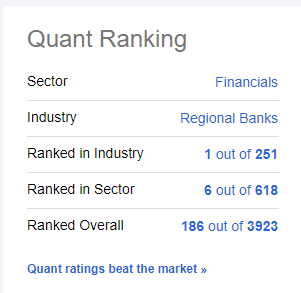
Why Eagle Bancorp Montana Is The Top-Ranked Regional Bank

Eagle Bancorp Montana: Benefits Of Loan Growth Appear To Be Incorporated In The Stock Price

Royal Bank of Canada Buys 23,285 Shares of Eagle Bancorp, Inc. (NASDAQ:EGBN)

Federated Hermes Inc. Boosts Stock Position in Eagle Bancorp, Inc. (NASDAQ:EGBN)

Eagle Bancorp Montana Inc (NASDAQ:EBMT) Given $22.17 Average Target Price by Analysts

Eagle Bancorp adds industry veterans to leadership team
Source: https://incomestatements.info
Category: Stock Reports
