See more : Subros Limited (SUBROS.BO) Income Statement Analysis – Financial Results
Complete financial analysis of Eagle Bancorp Montana, Inc. (EBMT) income statement, including revenue, profit margins, EPS and key performance metrics. Get detailed insights into the financial performance of Eagle Bancorp Montana, Inc., a leading company in the Banks – Regional industry within the Financial Services sector.
- City Office REIT, Inc. (CIO-PA) Income Statement Analysis – Financial Results
- MYR Group Inc. (MYRG) Income Statement Analysis – Financial Results
- EDP – Energias do Brasil S.A. (ENBR3.SA) Income Statement Analysis – Financial Results
- MedMira Inc. (MMIRF) Income Statement Analysis – Financial Results
- MITSUI-SOKO HOLDINGS Co., Ltd. (9302.T) Income Statement Analysis – Financial Results
Eagle Bancorp Montana, Inc. (EBMT)
About Eagle Bancorp Montana, Inc.
Eagle Bancorp Montana, Inc. operates as the bank holding company for Opportunity Bank of Montana that provides various retail banking products and services to small businesses and individuals in Montana. It accepts various deposit products, such as checking, savings, money market, and individual retirement accounts, as well as certificates of deposit accounts. The company also provides 1-4 family residential mortgage loans, such as residential mortgages and construction of residential properties; commercial real estate loans, including multi-family dwellings, nonresidential property, commercial construction and development, and farmland loans; and second mortgage/home equity loans. In addition, it offers consumer loans, such as loans secured by collateral other than real estate, such as automobiles, recreational vehicles, and boats; personal loans and lines of credit; commercial business loans consisting of business loans and lines of credit on a secured and unsecured basis; construction loans; agricultural loans; and mortgage loan services. The company operates 23 full-service branches, 1 community banking office, and 25 automated teller machines. Eagle Bancorp Montana, Inc. was founded in 1922 and is headquartered in Helena, Montana.
| Metric | 2023 | 2022 | 2021 | 2020 | 2019 | 2018 | 2017 | 2016 | 2015 | 2014 | 2013 | 2012 | 2011 | 2010 | 2009 |
|---|---|---|---|---|---|---|---|---|---|---|---|---|---|---|---|
| Revenue | 83.74M | 4.28M | 91.57M | 90.35M | 61.60M | 42.43M | 38.10M | 36.78M | 29.77M | 25.28M | 22.87M | 15.11M | 15.50M | 13.40M | 12.23M |
| Cost of Revenue | 0.00 | 0.00 | 0.00 | 0.00 | 0.00 | 0.00 | 0.00 | 0.00 | 0.00 | 0.00 | 0.00 | 0.00 | 0.00 | 0.00 | 0.00 |
| Gross Profit | 83.74M | 4.28M | 91.57M | 90.35M | 61.60M | 42.43M | 38.10M | 36.78M | 29.77M | 25.28M | 22.87M | 15.11M | 15.50M | 13.40M | 12.23M |
| Gross Profit Ratio | 100.00% | 100.00% | 100.00% | 100.00% | 100.00% | 100.00% | 100.00% | 100.00% | 100.00% | 100.00% | 100.00% | 100.00% | 100.00% | 100.00% | 100.00% |
| Research & Development | 0.00 | 0.00 | 0.00 | 0.00 | 0.00 | 0.00 | 0.00 | 0.00 | 0.00 | 0.00 | 0.00 | 0.00 | 0.00 | 0.00 | 0.00 |
| General & Administrative | 44.12M | 45.08M | 54.52M | 44.14M | 31.73M | 24.24M | 20.62M | 18.86M | 17.12M | 15.14M | 12.07M | 6.86M | 6.44M | 5.73M | 5.28M |
| Selling & Marketing | 1.38M | 1.42M | 1.28M | 911.00K | 1.03M | 1.16M | 966.00K | 696.00K | 800.00K | 816.00K | 946.00K | 568.00K | 524.00K | 438.00K | 394.00K |
| SG&A | 45.50M | 46.50M | 55.80M | 45.05M | 32.75M | 25.39M | 21.59M | 19.56M | 17.92M | 15.95M | 13.02M | 7.43M | 6.96M | 6.16M | 5.67M |
| Other Expenses | 0.00 | -19.27M | -128.09M | -106.97M | -80.39M | -9.56M | -8.26M | -7.67M | 0.00 | 0.00 | 0.00 | 0.00 | 0.00 | 0.00 | 0.00 |
| Operating Expenses | 60.29M | 2.89M | -72.29M | -61.91M | -47.64M | 25.39M | 21.59M | 19.56M | 17.92M | 15.95M | 13.02M | 7.09M | 6.60M | 6.16M | 5.67M |
| Cost & Expenses | 83.31M | 2.89M | -72.29M | -61.91M | -47.64M | 25.39M | 21.59M | 19.56M | 17.92M | 15.95M | 13.02M | 7.09M | 6.60M | 6.16M | 5.67M |
| Interest Income | 90.89M | 69.16M | 49.49M | 49.28M | 46.10M | 34.52M | 27.69M | 23.77M | 20.40M | 17.28M | 14.80M | 14.09M | 14.95M | 14.91M | 15.35M |
| Interest Expense | 29.14M | 6.15M | 3.21M | 6.48M | 7.73M | 5.10M | 4.09M | 3.12M | 2.45M | 2.04M | 2.24M | 3.16M | 4.08M | 5.11M | 6.12M |
| Depreciation & Amortization | 0.00 | 5.59M | 4.12M | 3.57M | 2.60M | 1.98M | 1.40M | 1.50M | 1.23M | 1.06M | 1.11M | 629.00K | 1.16M | 1.14M | 1.08M |
| EBITDA | 0.00 | 0.00 | 0.00 | 42.42M | 19.33M | 0.00 | 9.80M | 10.93M | 5.21M | 2.30M | 0.00 | 0.00 | 0.00 | 8.06M | 7.53M |
| EBITDA Ratio | 0.00% | 647.51% | 21.68% | 32.21% | 24.43% | 33.42% | 33.61% | 34.80% | 25.73% | 23.77% | 24.55% | 49.81% | 60.98% | 72.36% | 86.72% |
| Operating Income | 1.76M | 26.37M | 19.28M | 28.44M | 13.97M | 11.00M | 10.33M | 10.05M | 5.20M | 3.81M | 3.57M | 6.14M | 7.55M | 8.55M | 9.53M |
| Operating Income Ratio | 2.10% | 616.34% | 21.06% | 31.48% | 22.67% | 25.92% | 27.10% | 27.32% | 17.46% | 15.06% | 15.61% | 40.62% | 48.74% | 63.86% | 77.89% |
| Total Other Income/Expenses | 9.89M | -12.68M | -9.30M | -9.48M | -7.89M | -5.72M | -5.85M | -5.45M | -4.05M | -2.05M | -2.25M | -5.30M | -985.00K | -5.11M | -6.12M |
| Income Before Tax | 11.65M | 13.85M | 19.28M | 28.44M | 13.97M | 5.90M | 6.23M | 6.93M | 2.74M | 1.76M | 1.32M | 2.97M | 3.47M | 3.45M | 3.41M |
| Income Before Tax Ratio | 13.92% | 323.63% | 21.06% | 31.48% | 22.67% | 13.89% | 16.36% | 18.84% | 9.21% | 6.97% | 5.79% | 19.66% | 22.37% | 25.75% | 27.89% |
| Income Tax Expense | 1.60M | 3.15M | 4.86M | 7.23M | 3.10M | 914.00K | 2.13M | 1.80M | 163.00K | -350.00K | -650.00K | 792.00K | 1.06M | 1.04M | 1.02M |
| Net Income | 10.06M | 10.70M | 14.42M | 21.21M | 10.87M | 4.98M | 4.10M | 5.13M | 2.58M | 2.11M | 1.97M | 2.18M | 2.41M | 2.41M | 2.39M |
| Net Income Ratio | 12.01% | 250.08% | 15.75% | 23.47% | 17.65% | 11.74% | 10.77% | 13.95% | 8.67% | 8.35% | 8.63% | 14.42% | 15.55% | 18.02% | 19.52% |
| EPS | 1.29 | 1.45 | 2.17 | 3.12 | 1.69 | 0.92 | 1.01 | 1.36 | 0.68 | 0.54 | 0.53 | 0.58 | 0.62 | 0.60 | 0.59 |
| EPS Diluted | 1.29 | 1.45 | 2.17 | 3.11 | 1.69 | 0.91 | 0.99 | 1.32 | 0.67 | 0.53 | 0.50 | 0.56 | 0.62 | 0.54 | 0.51 |
| Weighted Avg Shares Out | 7.79M | 7.38M | 6.65M | 6.80M | 6.42M | 5.43M | 4.07M | 3.78M | 3.81M | 3.91M | 3.74M | 3.73M | 3.89M | 4.04M | 4.07M |
| Weighted Avg Shares Out (Dil) | 7.80M | 7.39M | 6.66M | 6.82M | 6.44M | 5.49M | 4.13M | 3.87M | 3.86M | 3.97M | 3.94M | 3.90M | 3.90M | 4.47M | 4.64M |

7 of the Best Bank Stocks to Cash In On

State Street Corp Buys 66,454 Shares of Eagle Bancorp, Inc. (NASDAQ:EGBN)
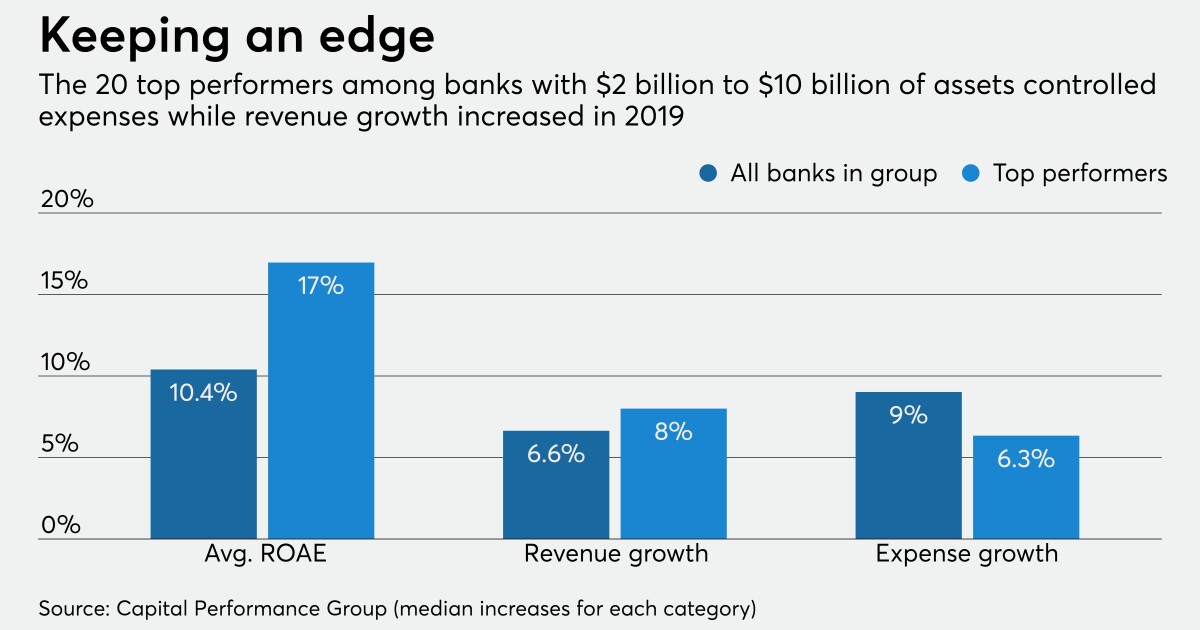
Once-highflying community banks encounter turbulence

Dividend Champion And Contender Highlights: Week Of May 31

Dividend Champion And Contender Highlights: Week Of May 10

Eagle Bancorp (NASDAQ:EGBN) Lifted to "Sell" at BidaskClub

Eagle Bancorp, Inc. (NASDAQ:EGBN) Given Average Rating of "Hold" by Brokerages

Zacks Investment Research Upgrades Eagle Bancorp Montana (NASDAQ:EBMT) to "Hold"

Edited Transcript of EGBN earnings conference call or presentation 23-Apr-20 2:00pm GMT

Eagle Bancorp Inc (EGBN) Q1 2020 Earnings Call Transcript
Source: https://incomestatements.info
Category: Stock Reports
