See more : WEC Energy Group, Inc. (WEC) Income Statement Analysis – Financial Results
Complete financial analysis of Global Energy Metals Corporation (GBLEF) income statement, including revenue, profit margins, EPS and key performance metrics. Get detailed insights into the financial performance of Global Energy Metals Corporation, a leading company in the Industrial Materials industry within the Basic Materials sector.
- Laxmi Organic Industries Limited (LXCHEM.BO) Income Statement Analysis – Financial Results
- Tokyu Corporation (TOKUY) Income Statement Analysis – Financial Results
- Sumber Mineral Global Abadi Tbk (SMGA.JK) Income Statement Analysis – Financial Results
- Arkema S.A. (ARKAY) Income Statement Analysis – Financial Results
- Teijin Limited (TINLF) Income Statement Analysis – Financial Results
Global Energy Metals Corporation (GBLEF)
About Global Energy Metals Corporation
Global Energy Metals Corporation engages in the exploration for resource properties in Canada, Australia, and the United States. It explores for cobalt, copper, nickel, gold, silver, and base metal deposits. The company holds interests in the Werner Lake property located in Kenora, Ontario; the Millennium and Mount Isa projects situated in Mount Isa, Queensland; and the Lovelock Mine and Treasure Box projects in Churchill County, Nevada. It also holds interest in the Rana nickel-copper-cobalt project, which include the Bruvann nickel mine located in Northern Norway. In addition, the company holds interest in the Monument Peak copper-silver-gold property covering an area of approximately 691 hectares located in the Idaho; and the Chance Lake property comprising 16 contiguous claims, which covers approximately 777.7 hectares; and the Amiral property comprising 40 contiguous mineral claims covering an area of approximately 2,162.5 hectares located in Quebec, Canada. Global Energy Metals Corporation was incorporated in 2015 and is headquartered in Vancouver, Canada.
| Metric | 2023 | 2022 | 2021 | 2020 | 2019 | 2018 | 2017 | 2016 | 2015 |
|---|---|---|---|---|---|---|---|---|---|
| Revenue | 0.00 | 0.00 | 0.00 | 0.00 | 0.00 | 0.00 | 0.00 | 0.00 | 0.00 |
| Cost of Revenue | 34.11K | 35.50K | 46.29K | 44.87K | 0.00 | 1.43K | 1.46K | 730.00 | 0.00 |
| Gross Profit | -34.11K | -35.50K | -46.29K | -44.87K | 0.00 | -1.43K | -1.46K | -730.00 | 0.00 |
| Gross Profit Ratio | 0.00% | 0.00% | 0.00% | 0.00% | 0.00% | 0.00% | 0.00% | 0.00% | 0.00% |
| Research & Development | 0.00 | 122.00K | 0.00 | 0.00 | 0.00 | 152.46K | 0.00 | 0.00 | 0.00 |
| General & Administrative | 651.46K | 615.46K | 895.44K | 437.70K | 641.54K | 918.76K | 1.77M | 267.62K | 3.22M |
| Selling & Marketing | 163.31K | 599.82K | 201.18K | 62.38K | 232.40K | 148.36K | 221.84K | 62.47K | 2.35M |
| SG&A | 1.12M | 1.22M | 1.10M | 500.08K | 873.95K | 1.07M | 1.99M | 330.09K | 10.59M |
| Other Expenses | 5.81K | 21.53K | 76.15K | 10.36K | 0.00 | 190.05K | 0.00 | 0.00 | 0.00 |
| Operating Expenses | 1.12M | 1.22M | 1.10M | 500.08K | 873.95K | 1.07M | 1.99M | 330.09K | 10.59M |
| Cost & Expenses | 1.15M | 1.25M | 1.14M | 544.95K | 873.95K | 1.07M | 1.99M | 330.09K | 10.59M |
| Interest Income | 0.00 | 0.00 | 0.00 | 0.00 | 0.00 | 0.00 | 0.00 | 0.00 | 0.00 |
| Interest Expense | 1.59K | 4.20K | 8.15K | 9.41K | 0.00 | 0.00 | 73.07K | 26.57K | 0.00 |
| Depreciation & Amortization | 1.15M | 35.50K | 46.29K | 44.87K | 1.43K | 1.43K | 1.46K | 730.00 | 10.59M |
| EBITDA | -1.11M | -1.19M | -1.02M | -489.72K | -786.80K | -875.63K | -1.99M | -269.53K | 0.00 |
| EBITDA Ratio | 0.00% | 0.00% | 0.00% | 0.00% | 0.00% | 0.00% | 0.00% | 0.00% | 0.00% |
| Operating Income | -1.15M | -1.25M | -1.15M | -534.59K | -786.80K | -1.07M | -1.99M | -330.09K | -10.59M |
| Operating Income Ratio | 0.00% | 0.00% | 0.00% | 0.00% | 0.00% | 0.00% | 0.00% | 0.00% | 0.00% |
| Total Other Income/Expenses | -3.78M | 17.33K | 75.85K | -58.50K | -150.87K | 113.82K | 829.51K | -26.57K | 0.00 |
| Income Before Tax | -4.93M | -1.23M | -1.08M | -603.44K | -961.09K | -868.31K | -1.16M | -356.65K | -10.59M |
| Income Before Tax Ratio | 0.00% | 0.00% | 0.00% | 0.00% | 0.00% | 0.00% | 0.00% | 0.00% | 0.00% |
| Income Tax Expense | 0.00 | 25.72K | 84.30K | 19.77K | 87.14K | 190.05K | 73.07K | 0.00 | 0.00 |
| Net Income | -4.93M | -1.23M | -1.08M | -603.44K | -961.09K | -868.31K | -1.16M | -356.65K | -10.59M |
| Net Income Ratio | 0.00% | 0.00% | 0.00% | 0.00% | 0.00% | 0.00% | 0.00% | 0.00% | 0.00% |
| EPS | -0.14 | -0.04 | -0.07 | -0.06 | -0.17 | -0.21 | -0.45 | -0.19 | 0.00 |
| EPS Diluted | -0.14 | -0.04 | -0.07 | -0.06 | -0.17 | -0.21 | -0.45 | -0.19 | 0.00 |
| Weighted Avg Shares Out | 35.40M | 28.88M | 16.31M | 9.70M | 5.58M | 4.22M | 2.58M | 1.92M | 0.00 |
| Weighted Avg Shares Out (Dil) | 35.40M | 28.88M | 16.31M | 9.70M | 5.58M | 4.22M | 2.58M | 1.92M | 0.00 |
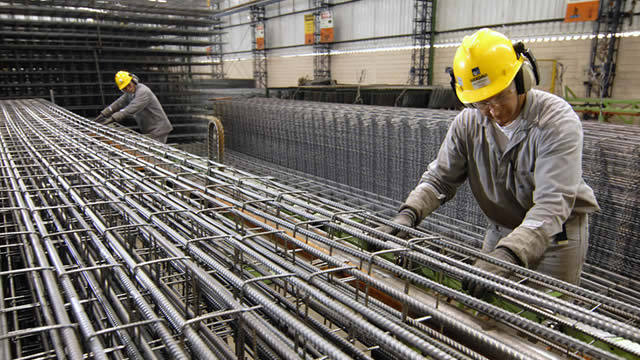
Global Energy Metals explores potential graphite discovery at Millennium project
Global Energy Metals provides portfolio update highlighting developments in Australia, Jordan, and Saudi Arabia
Global Energy Metals Corporation announces agreement between Terra Balcanica and Fulcrum Metals
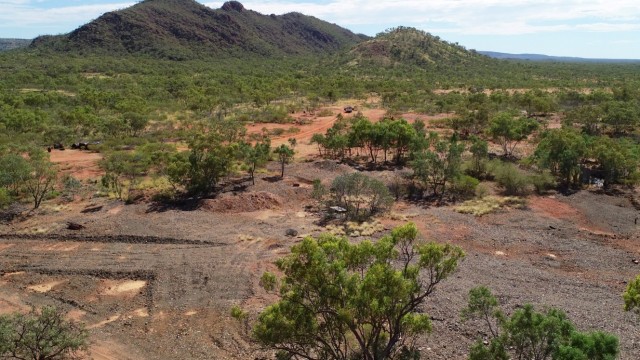
Global Energy Metals encouraged by drills turning at Millennium copper-cobalt property
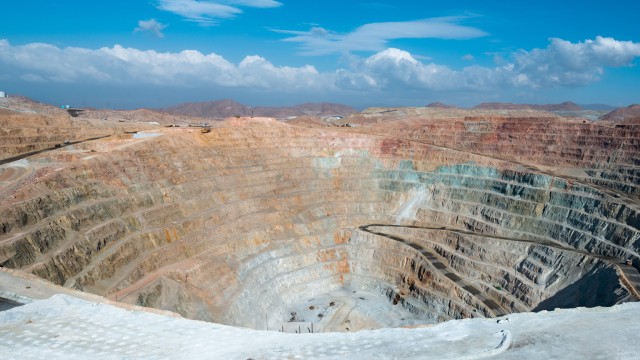
Cobalt Miners News For The Month Of April 2024

Global Energy Metals CEO to speak at Turkiye Critical Minerals Summit

Global Energy Metals CEO to speak at Turkiye Critical Minerals Summit

Global Energy Metals unveils summer exploration strategy for Monument Peak copper-silver-gold project

Global Energy Metals unveils summer exploration strategy for Monument Peak copper-silver-gold project
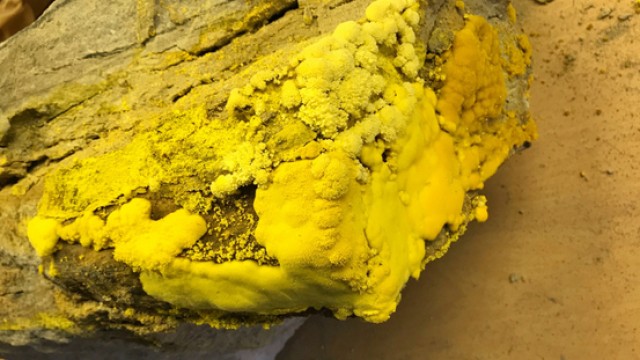
Global Energy Metals strikes deal with Terra Balcanica Resources for uranium royalty
Source: https://incomestatements.info
Category: Stock Reports
