See more : Evergreen Corporation (EVGRW) Income Statement Analysis – Financial Results
Complete financial analysis of Global Energy Metals Corporation (GBLEF) income statement, including revenue, profit margins, EPS and key performance metrics. Get detailed insights into the financial performance of Global Energy Metals Corporation, a leading company in the Industrial Materials industry within the Basic Materials sector.
- Magni-Tech Industries Berhad (7087.KL) Income Statement Analysis – Financial Results
- Biotech Acquisition Company (BIOT) Income Statement Analysis – Financial Results
- TINAVI Medical Technologies Co., Ltd. (688277.SS) Income Statement Analysis – Financial Results
- Media Kobo, Inc. (3815.T) Income Statement Analysis – Financial Results
- Sunrise Realty Trust, Inc. Common Stock When-Issued (SUNSV) Income Statement Analysis – Financial Results
Global Energy Metals Corporation (GBLEF)
About Global Energy Metals Corporation
Global Energy Metals Corporation engages in the exploration for resource properties in Canada, Australia, and the United States. It explores for cobalt, copper, nickel, gold, silver, and base metal deposits. The company holds interests in the Werner Lake property located in Kenora, Ontario; the Millennium and Mount Isa projects situated in Mount Isa, Queensland; and the Lovelock Mine and Treasure Box projects in Churchill County, Nevada. It also holds interest in the Rana nickel-copper-cobalt project, which include the Bruvann nickel mine located in Northern Norway. In addition, the company holds interest in the Monument Peak copper-silver-gold property covering an area of approximately 691 hectares located in the Idaho; and the Chance Lake property comprising 16 contiguous claims, which covers approximately 777.7 hectares; and the Amiral property comprising 40 contiguous mineral claims covering an area of approximately 2,162.5 hectares located in Quebec, Canada. Global Energy Metals Corporation was incorporated in 2015 and is headquartered in Vancouver, Canada.
| Metric | 2023 | 2022 | 2021 | 2020 | 2019 | 2018 | 2017 | 2016 | 2015 |
|---|---|---|---|---|---|---|---|---|---|
| Revenue | 0.00 | 0.00 | 0.00 | 0.00 | 0.00 | 0.00 | 0.00 | 0.00 | 0.00 |
| Cost of Revenue | 34.11K | 35.50K | 46.29K | 44.87K | 0.00 | 1.43K | 1.46K | 730.00 | 0.00 |
| Gross Profit | -34.11K | -35.50K | -46.29K | -44.87K | 0.00 | -1.43K | -1.46K | -730.00 | 0.00 |
| Gross Profit Ratio | 0.00% | 0.00% | 0.00% | 0.00% | 0.00% | 0.00% | 0.00% | 0.00% | 0.00% |
| Research & Development | 0.00 | 122.00K | 0.00 | 0.00 | 0.00 | 152.46K | 0.00 | 0.00 | 0.00 |
| General & Administrative | 651.46K | 615.46K | 895.44K | 437.70K | 641.54K | 918.76K | 1.77M | 267.62K | 3.22M |
| Selling & Marketing | 163.31K | 599.82K | 201.18K | 62.38K | 232.40K | 148.36K | 221.84K | 62.47K | 2.35M |
| SG&A | 1.12M | 1.22M | 1.10M | 500.08K | 873.95K | 1.07M | 1.99M | 330.09K | 10.59M |
| Other Expenses | 5.81K | 21.53K | 76.15K | 10.36K | 0.00 | 190.05K | 0.00 | 0.00 | 0.00 |
| Operating Expenses | 1.12M | 1.22M | 1.10M | 500.08K | 873.95K | 1.07M | 1.99M | 330.09K | 10.59M |
| Cost & Expenses | 1.15M | 1.25M | 1.14M | 544.95K | 873.95K | 1.07M | 1.99M | 330.09K | 10.59M |
| Interest Income | 0.00 | 0.00 | 0.00 | 0.00 | 0.00 | 0.00 | 0.00 | 0.00 | 0.00 |
| Interest Expense | 1.59K | 4.20K | 8.15K | 9.41K | 0.00 | 0.00 | 73.07K | 26.57K | 0.00 |
| Depreciation & Amortization | 1.15M | 35.50K | 46.29K | 44.87K | 1.43K | 1.43K | 1.46K | 730.00 | 10.59M |
| EBITDA | -1.11M | -1.19M | -1.02M | -489.72K | -786.80K | -875.63K | -1.99M | -269.53K | 0.00 |
| EBITDA Ratio | 0.00% | 0.00% | 0.00% | 0.00% | 0.00% | 0.00% | 0.00% | 0.00% | 0.00% |
| Operating Income | -1.15M | -1.25M | -1.15M | -534.59K | -786.80K | -1.07M | -1.99M | -330.09K | -10.59M |
| Operating Income Ratio | 0.00% | 0.00% | 0.00% | 0.00% | 0.00% | 0.00% | 0.00% | 0.00% | 0.00% |
| Total Other Income/Expenses | -3.78M | 17.33K | 75.85K | -58.50K | -150.87K | 113.82K | 829.51K | -26.57K | 0.00 |
| Income Before Tax | -4.93M | -1.23M | -1.08M | -603.44K | -961.09K | -868.31K | -1.16M | -356.65K | -10.59M |
| Income Before Tax Ratio | 0.00% | 0.00% | 0.00% | 0.00% | 0.00% | 0.00% | 0.00% | 0.00% | 0.00% |
| Income Tax Expense | 0.00 | 25.72K | 84.30K | 19.77K | 87.14K | 190.05K | 73.07K | 0.00 | 0.00 |
| Net Income | -4.93M | -1.23M | -1.08M | -603.44K | -961.09K | -868.31K | -1.16M | -356.65K | -10.59M |
| Net Income Ratio | 0.00% | 0.00% | 0.00% | 0.00% | 0.00% | 0.00% | 0.00% | 0.00% | 0.00% |
| EPS | -0.14 | -0.04 | -0.07 | -0.06 | -0.17 | -0.21 | -0.45 | -0.19 | 0.00 |
| EPS Diluted | -0.14 | -0.04 | -0.07 | -0.06 | -0.17 | -0.21 | -0.45 | -0.19 | 0.00 |
| Weighted Avg Shares Out | 35.40M | 28.88M | 16.31M | 9.70M | 5.58M | 4.22M | 2.58M | 1.92M | 0.00 |
| Weighted Avg Shares Out (Dil) | 35.40M | 28.88M | 16.31M | 9.70M | 5.58M | 4.22M | 2.58M | 1.92M | 0.00 |

Global Energy Metals Corp inks agreement with High-Tech Metals Ltd to sell its interest in the Werner Lake cobalt project
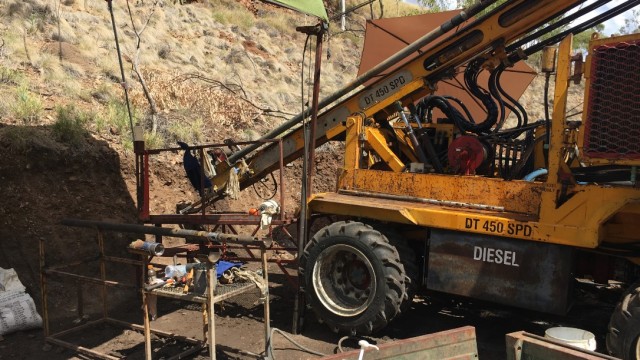
Global Energy Metals says exploration update from Australian project proves potential of Millennium copper-cobalt-gold resource
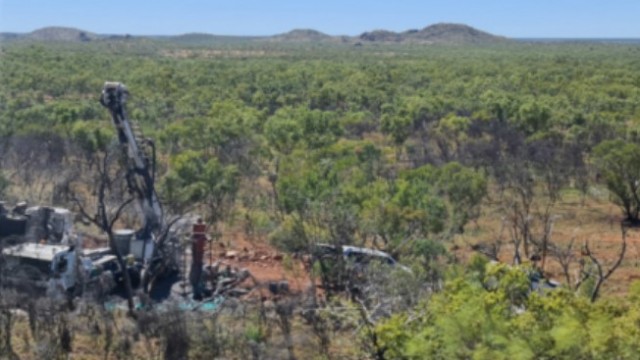
Global Energy Metals welcomes results of MBK funded exploration program at Millennium project, Australia
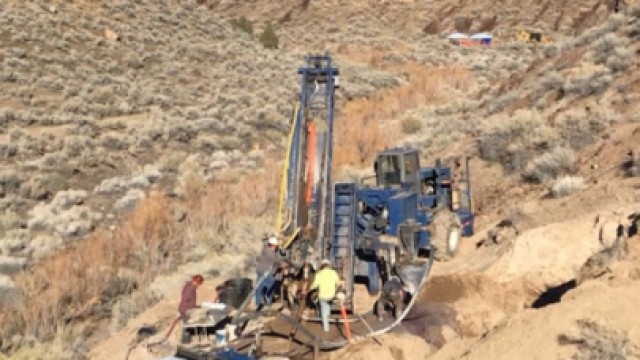
Global Energy Metals to explore 30 targets after new mineral findings in Nevada
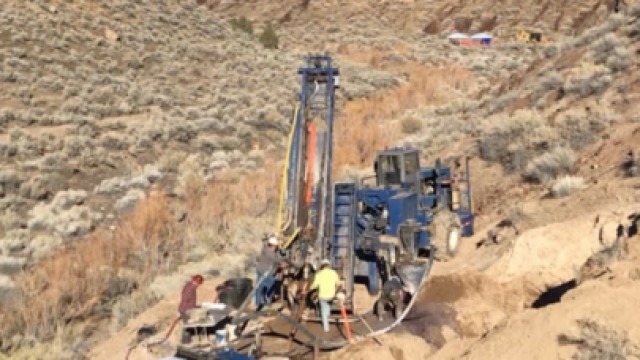
Global Energy Metals poised for field program at Nevada battery metals projects after Earthlabs study
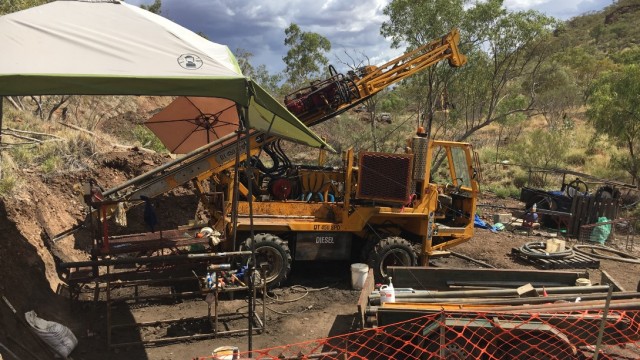
Global Energy Metals Corp updates on Millennium cobalt-copper-gold project in Queensland, Australia
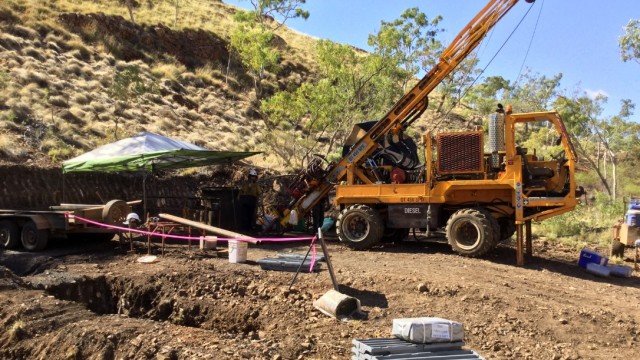
Global Energy Metals Corporation initializes summer exploration program at Lovelock and Treasure Box projects
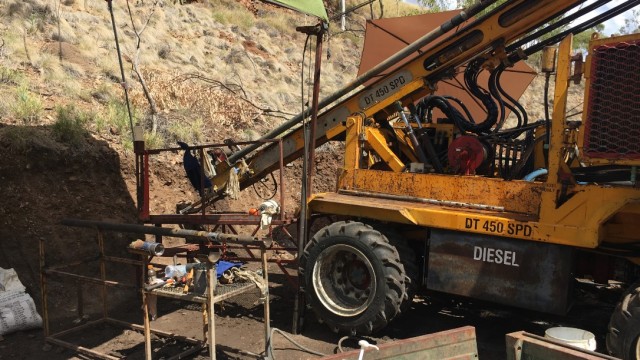
Global Energy Metals completes reverse circulation drill program at Australia Millennium Cobalt-Copper-Gold project
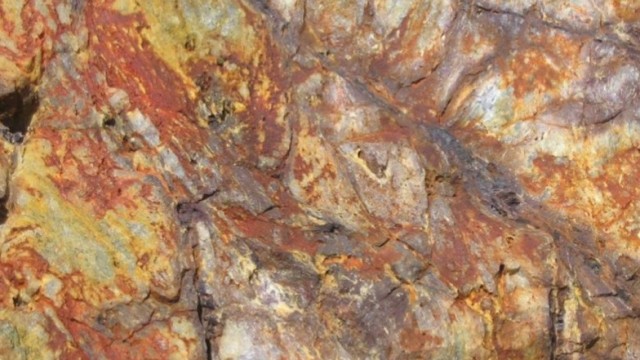
Global Energy Metals says Monument Peak project has the potential to host significant copper-silver-gold deposit
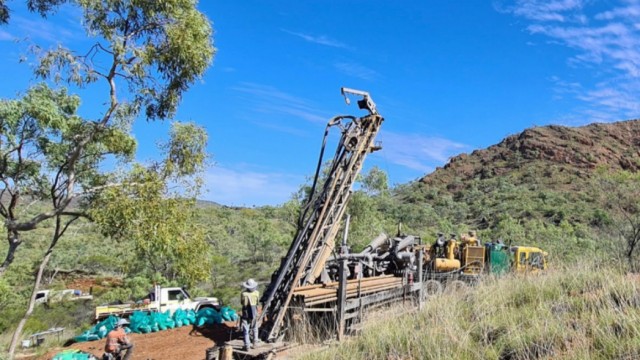
Global Energy Metals says initial drilling at its Millennium cobalt, copper, and gold project in Queensland indicates potential for resource expansion
Source: https://incomestatements.info
Category: Stock Reports
