See more : Artner Co.,Ltd. (2163.T) Income Statement Analysis – Financial Results
Complete financial analysis of Global Energy Metals Corporation (GBLEF) income statement, including revenue, profit margins, EPS and key performance metrics. Get detailed insights into the financial performance of Global Energy Metals Corporation, a leading company in the Industrial Materials industry within the Basic Materials sector.
- VWF Bancorp, Inc. (VWFB) Income Statement Analysis – Financial Results
- Maxvision Technology Corp. (002990.SZ) Income Statement Analysis – Financial Results
- International Zeolite Corp. (IZCFF) Income Statement Analysis – Financial Results
- Talen Energy Corporation (TLN) Income Statement Analysis – Financial Results
- Yancoal Australia Ltd (YACAF) Income Statement Analysis – Financial Results
Global Energy Metals Corporation (GBLEF)
About Global Energy Metals Corporation
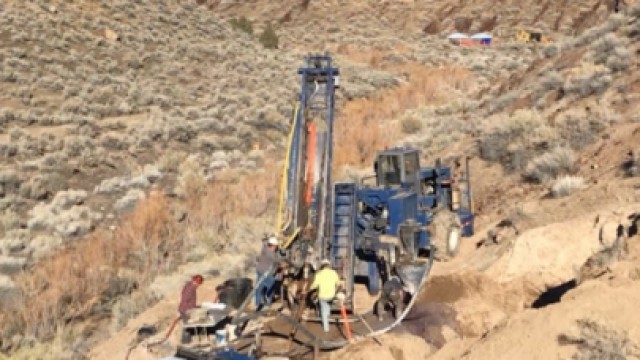
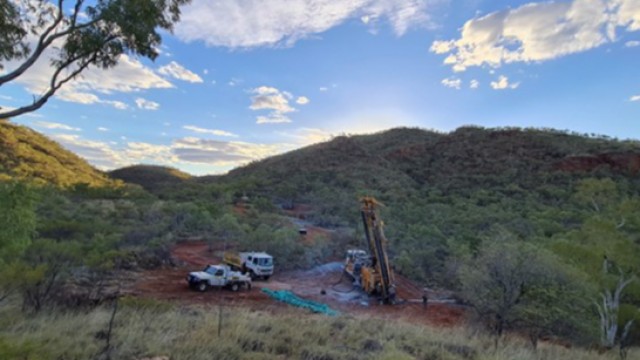
Global Energy Metals Corporation engages in the exploration for resource properties in Canada, Australia, and the United States. It explores for cobalt, copper, nickel, gold, silver, and base metal deposits. The company holds interests in the Werner Lake property located in Kenora, Ontario; the Millennium and Mount Isa projects situated in Mount Isa, Queensland; and the Lovelock Mine and Treasure Box projects in Churchill County, Nevada. It also holds interest in the Rana nickel-copper-cobalt project, which include the Bruvann nickel mine located in Northern Norway. In addition, the company holds interest in the Monument Peak copper-silver-gold property covering an area of approximately 691 hectares located in the Idaho; and the Chance Lake property comprising 16 contiguous claims, which covers approximately 777.7 hectares; and the Amiral property comprising 40 contiguous mineral claims covering an area of approximately 2,162.5 hectares located in Quebec, Canada. Global Energy Metals Corporation was incorporated in 2015 and is headquartered in Vancouver, Canada.
| Metric | 2023 | 2022 | 2021 | 2020 | 2019 | 2018 | 2017 | 2016 | 2015 |
|---|---|---|---|---|---|---|---|---|---|
| Revenue | 0.00 | 0.00 | 0.00 | 0.00 | 0.00 | 0.00 | 0.00 | 0.00 | 0.00 |
| Cost of Revenue | 34.11K | 35.50K | 46.29K | 44.87K | 0.00 | 1.43K | 1.46K | 730.00 | 0.00 |
| Gross Profit | -34.11K | -35.50K | -46.29K | -44.87K | 0.00 | -1.43K | -1.46K | -730.00 | 0.00 |
| Gross Profit Ratio | 0.00% | 0.00% | 0.00% | 0.00% | 0.00% | 0.00% | 0.00% | 0.00% | 0.00% |
| Research & Development | 0.00 | 122.00K | 0.00 | 0.00 | 0.00 | 152.46K | 0.00 | 0.00 | 0.00 |
| General & Administrative | 651.46K | 615.46K | 895.44K | 437.70K | 641.54K | 918.76K | 1.77M | 267.62K | 3.22M |
| Selling & Marketing | 163.31K | 599.82K | 201.18K | 62.38K | 232.40K | 148.36K | 221.84K | 62.47K | 2.35M |
| SG&A | 1.12M | 1.22M | 1.10M | 500.08K | 873.95K | 1.07M | 1.99M | 330.09K | 10.59M |
| Other Expenses | 5.81K | 21.53K | 76.15K | 10.36K | 0.00 | 190.05K | 0.00 | 0.00 | 0.00 |
| Operating Expenses | 1.12M | 1.22M | 1.10M | 500.08K | 873.95K | 1.07M | 1.99M | 330.09K | 10.59M |
| Cost & Expenses | 1.15M | 1.25M | 1.14M | 544.95K | 873.95K | 1.07M | 1.99M | 330.09K | 10.59M |
| Interest Income | 0.00 | 0.00 | 0.00 | 0.00 | 0.00 | 0.00 | 0.00 | 0.00 | 0.00 |
| Interest Expense | 1.59K | 4.20K | 8.15K | 9.41K | 0.00 | 0.00 | 73.07K | 26.57K | 0.00 |
| Depreciation & Amortization | 1.15M | 35.50K | 46.29K | 44.87K | 1.43K | 1.43K | 1.46K | 730.00 | 10.59M |
| EBITDA | -1.11M | -1.19M | -1.02M | -489.72K | -786.80K | -875.63K | -1.99M | -269.53K | 0.00 |
| EBITDA Ratio | 0.00% | 0.00% | 0.00% | 0.00% | 0.00% | 0.00% | 0.00% | 0.00% | 0.00% |
| Operating Income | -1.15M | -1.25M | -1.15M | -534.59K | -786.80K | -1.07M | -1.99M | -330.09K | -10.59M |
| Operating Income Ratio | 0.00% | 0.00% | 0.00% | 0.00% | 0.00% | 0.00% | 0.00% | 0.00% | 0.00% |
| Total Other Income/Expenses | -3.78M | 17.33K | 75.85K | -58.50K | -150.87K | 113.82K | 829.51K | -26.57K | 0.00 |
| Income Before Tax | -4.93M | -1.23M | -1.08M | -603.44K | -961.09K | -868.31K | -1.16M | -356.65K | -10.59M |
| Income Before Tax Ratio | 0.00% | 0.00% | 0.00% | 0.00% | 0.00% | 0.00% | 0.00% | 0.00% | 0.00% |
| Income Tax Expense | 0.00 | 25.72K | 84.30K | 19.77K | 87.14K | 190.05K | 73.07K | 0.00 | 0.00 |
| Net Income | -4.93M | -1.23M | -1.08M | -603.44K | -961.09K | -868.31K | -1.16M | -356.65K | -10.59M |
| Net Income Ratio | 0.00% | 0.00% | 0.00% | 0.00% | 0.00% | 0.00% | 0.00% | 0.00% | 0.00% |
| EPS | -0.14 | -0.04 | -0.07 | -0.06 | -0.17 | -0.21 | -0.45 | -0.19 | 0.00 |
| EPS Diluted | -0.14 | -0.04 | -0.07 | -0.06 | -0.17 | -0.21 | -0.45 | -0.19 | 0.00 |
| Weighted Avg Shares Out | 35.40M | 28.88M | 16.31M | 9.70M | 5.58M | 4.22M | 2.58M | 1.92M | 0.00 |
| Weighted Avg Shares Out (Dil) | 35.40M | 28.88M | 16.31M | 9.70M | 5.58M | 4.22M | 2.58M | 1.92M | 0.00 |

Global Energy Metals CEO says shareholders expected to benefit greatly as electric revolution strengthens

Global Energy Metals intersects nickel, copper, and cobalt mineralization at Lovelock

Global Energy Metals closes final tranche of a non-brokered private placement for aggregate gross proceeds of $165,625

Global Energy Metals bolsters land position and starts interpreting findings at Monument Peak copper-silver-gold project

Global Energy Metals executes drilling contract with Schonknecht Drilling for 2022 work at the Millennium Project in NW Queensland

Global Energy Metals says it has entered into a strategic relationship with GoldSpot Discoveries Corp

Global Energy Metals receives approval to drill its Treasure Box project in Nevada

Global Energy Metals kicks off extensive geophysical works at its Treasure Box project in Nevada

Global Energy Metals closes Rana nickel royalty sale to Electric Royalties; provides Lovelock drilling update

Global Energy Metals well positioned for success as world turns to greener future, says CEO Smith
Source: https://incomestatements.info
Category: Stock Reports
