See more : Uniflex Technology Inc. (3321.TW) Income Statement Analysis – Financial Results
Complete financial analysis of GLOBALFOUNDRIES Inc. (GFS) income statement, including revenue, profit margins, EPS and key performance metrics. Get detailed insights into the financial performance of GLOBALFOUNDRIES Inc., a leading company in the Semiconductors industry within the Technology sector.
- Fisker Inc. (FSRNQ) Income Statement Analysis – Financial Results
- Persimmon Plc (PSMMF) Income Statement Analysis – Financial Results
- Masco Corporation (0JZ1.L) Income Statement Analysis – Financial Results
- Invacare Corporation (IVC) Income Statement Analysis – Financial Results
- Kinross Gold Corporation (KGC) Income Statement Analysis – Financial Results
GLOBALFOUNDRIES Inc. (GFS)
About GLOBALFOUNDRIES Inc.
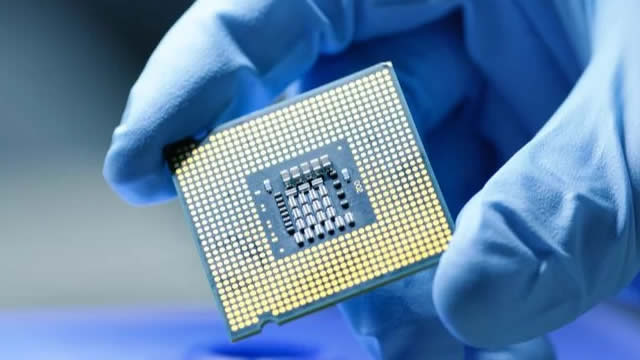
GLOBALFOUNDRIES Inc. operates as a semiconductor foundry worldwide. It manufactures integrated circuits, which enable various electronic devices that are pervasive. The company manufactures a range of semiconductor devices, including microprocessors, mobile application processors, baseband processors, network processors, radio frequency modems, microcontrollers, power management units, and microelectromechanical systems, as well as offers mainstream wafer fabrication services and technologies. The company was founded in 2009 and is based in Malta, New York.
| Metric | 2023 | 2022 | 2021 | 2020 | 2019 | 2018 |
|---|---|---|---|---|---|---|
| Revenue | 7.39B | 8.11B | 6.59B | 4.85B | 5.81B | 6.20B |
| Cost of Revenue | 5.29B | 5.87B | 5.57B | 5.56B | 6.35B | 6.65B |
| Gross Profit | 2.10B | 2.24B | 1.01B | -712.72M | -532.24M | -450.05M |
| Gross Profit Ratio | 28.42% | 27.61% | 15.38% | -14.69% | -9.16% | -7.26% |
| Research & Development | 428.00M | 482.00M | 478.00M | 475.77M | 582.97M | 926.22M |
| General & Administrative | 448.00M | 451.00M | 545.03M | 287.64M | 358.94M | 325.27M |
| Selling & Marketing | 0.00 | 45.00M | 49.97M | 0.00 | 0.00 | 0.00 |
| SG&A | 448.00M | 496.00M | 595.00M | 287.64M | 358.94M | 325.27M |
| Other Expenses | 96.00M | 22.00M | -8.00M | 157.22M | 86.69M | 61.33M |
| Operating Expenses | 972.00M | 978.00M | 1.07B | 920.63M | 1.03B | 1.38B |
| Cost & Expenses | 6.26B | 6.85B | 6.65B | 6.48B | 7.37B | 8.03B |
| Interest Income | 149.00M | 51.00M | 5.70M | 3.10M | 11.38M | 10.28M |
| Interest Expense | 137.00M | 60.00M | 108.00M | 132.66M | 202.78M | 137.51M |
| Depreciation & Amortization | 1.45B | 1.62B | 1.62B | 2.52B | 2.68B | 2.95B |
| EBITDA | 2.64B | 3.27B | 1.56B | 1.31B | 1.76B | 503.15M |
| EBITDA Ratio | 35.66% | 35.84% | 23.55% | 21.04% | 20.36% | 18.89% |
| Operating Income | 1.13B | 1.17B | -68.00M | -1.50B | -1.49B | -2.52B |
| Operating Income Ratio | 15.27% | 14.39% | -1.03% | -30.97% | -25.72% | -40.72% |
| Total Other Income/Expenses | -45.00M | 365.00M | -116.00M | 291.00M | 477.67M | -86.29M |
| Income Before Tax | 1.08B | 1.53B | -176.00M | -1.36B | -1.15B | -2.61B |
| Income Before Tax Ratio | 14.66% | 18.89% | -2.67% | -28.10% | -19.73% | -42.12% |
| Income Tax Expense | 66.00M | 86.00M | 78.00M | -12.27M | 224.06M | 16.45M |
| Net Income | 1.02B | 1.45B | -254.00M | -1.35B | -1.37B | -2.70B |
| Net Income Ratio | 13.80% | 17.86% | -3.86% | -27.85% | -23.59% | -43.60% |
| EPS | 1.85 | 2.69 | -0.50 | -1.35 | -1.36 | -5.08 |
| EPS Diluted | 1.83 | 2.62 | -0.50 | -1.35 | -1.36 | -5.08 |
| Weighted Avg Shares Out | 552.00M | 539.00M | 505.76M | 1.00B | 1.01B | 531.85M |
| Weighted Avg Shares Out (Dil) | 556.00M | 552.00M | 505.76M | 1.00B | 1.01B | 531.85M |

Soitec to supply wafers to GlobalFoundries' 9SW platform

GlobalFoundries GaN Chip Manufacturing Advances with $9.5 Million U.S. Federal Funding
Beyond NVIDIA: Top 5 Semiconductor Stocks to Watch for 2025
Dogs of Tech: 3 Semiconductor Stocks Set for a 2025 Rebound

US finalizes $1.5 billion chips award for GlobalFoundries to expand production

GlobalFoundries' poised to get final Chips Act award - source

Why Globalfoundries Rallied Today

Why Global Foundries Stock Jumped Today

GlobalFoundries CEO on earnings beat: smart devices and autos helped drive growth

GlobalFoundries, Inc. (GFS) Q3 2024 Earnings Call Transcript
Source: https://incomestatements.info
Category: Stock Reports
