See more : Berli Jucker Public Company Limited (NVP8.SG) Income Statement Analysis – Financial Results
Complete financial analysis of Intel Corporation (INTC) income statement, including revenue, profit margins, EPS and key performance metrics. Get detailed insights into the financial performance of Intel Corporation, a leading company in the Semiconductors industry within the Technology sector.
- Shanghai New Centurion Network Information Technology Co., Ltd. (605398.SS) Income Statement Analysis – Financial Results
- LyondellBasell Industries N.V. (0EDD.L) Income Statement Analysis – Financial Results
- LiveOne, Inc. (LVO) Income Statement Analysis – Financial Results
- Savera Industries Limited (SAVERA.BO) Income Statement Analysis – Financial Results
- China Medical & HealthCare Group Limited (COLRF) Income Statement Analysis – Financial Results
Intel Corporation (INTC)
About Intel Corporation
Intel Corporation engages in the design, manufacture, and sale of computer products and technologies worldwide. The company operates through CCG, DCG, IOTG, Mobileye, NSG, PSG, and All Other segments. It offers platform products, such as central processing units and chipsets, and system-on-chip and multichip packages; and non-platform or adjacent products, including accelerators, boards and systems, connectivity products, graphics, and memory and storage products. The company also provides high-performance compute solutions for targeted verticals and embedded applications for retail, industrial, and healthcare markets; and solutions for assisted and autonomous driving comprising compute platforms, computer vision and machine learning-based sensing, mapping and localization, driving policy, and active sensors. In addition, it offers workload-optimized platforms and related products for cloud service providers, enterprise and government, and communications service providers. The company serves original equipment manufacturers, original design manufacturers, and cloud service providers. Intel Corporation has a strategic partnership with MILA to develop and apply advances in artificial intelligence methods for enhancing the search in the space of drugs. The company was incorporated in 1968 and is headquartered in Santa Clara, California.
| Metric | 2023 | 2022 | 2021 | 2020 | 2019 | 2018 | 2017 | 2016 | 2015 | 2014 | 2013 | 2012 | 2011 | 2010 | 2009 | 2008 | 2007 | 2006 | 2005 | 2004 | 2003 | 2002 | 2001 | 2000 | 1999 | 1998 | 1997 | 1996 | 1995 | 1994 | 1993 | 1992 | 1991 | 1990 | 1989 | 1988 | 1987 | 1986 | 1985 |
|---|---|---|---|---|---|---|---|---|---|---|---|---|---|---|---|---|---|---|---|---|---|---|---|---|---|---|---|---|---|---|---|---|---|---|---|---|---|---|---|
| Revenue | 54.23B | 63.05B | 79.02B | 77.87B | 71.97B | 70.85B | 62.76B | 59.39B | 55.36B | 55.87B | 52.71B | 53.34B | 54.00B | 43.62B | 35.13B | 37.59B | 38.33B | 35.38B | 38.83B | 34.21B | 30.14B | 26.76B | 26.54B | 33.73B | 29.39B | 26.27B | 25.07B | 20.85B | 16.20B | 11.52B | 8.78B | 5.84B | 4.78B | 3.92B | 3.13B | 2.87B | 1.91B | 1.27B | 1.37B |
| Cost of Revenue | 32.52B | 36.19B | 35.21B | 34.26B | 29.83B | 27.11B | 23.69B | 23.20B | 20.68B | 20.26B | 21.19B | 20.19B | 20.24B | 14.81B | 15.57B | 16.74B | 18.43B | 17.16B | 15.78B | 14.46B | 13.05B | 13.45B | 13.49B | 12.65B | 11.84B | 12.14B | 9.95B | 9.16B | 7.81B | 5.58B | 2.54B | 2.04B | 1.90B | 1.64B | 1.48B | 1.30B | 872.10M | 687.20M | 777.20M |
| Gross Profit | 21.71B | 26.87B | 43.82B | 43.61B | 42.14B | 43.74B | 39.07B | 36.19B | 34.68B | 35.61B | 31.52B | 33.15B | 33.76B | 28.82B | 19.56B | 20.84B | 19.90B | 18.22B | 23.05B | 19.75B | 17.09B | 13.32B | 13.05B | 21.08B | 17.55B | 14.13B | 15.13B | 11.68B | 8.39B | 5.95B | 6.25B | 3.80B | 2.88B | 2.28B | 1.64B | 1.58B | 1.04B | 577.80M | 587.80M |
| Gross Profit Ratio | 40.04% | 42.61% | 55.45% | 56.01% | 58.56% | 61.73% | 62.25% | 60.94% | 62.65% | 63.74% | 59.80% | 62.15% | 62.51% | 66.05% | 55.69% | 55.46% | 51.92% | 51.49% | 59.36% | 57.72% | 56.71% | 49.76% | 49.18% | 62.49% | 59.73% | 53.78% | 60.33% | 56.04% | 51.79% | 51.60% | 71.13% | 65.10% | 60.30% | 58.23% | 52.55% | 54.95% | 54.27% | 45.68% | 43.06% |
| Research & Development | 16.05B | 17.53B | 15.19B | 13.56B | 13.36B | 13.54B | 13.10B | 12.74B | 12.13B | 11.54B | 10.61B | 10.15B | 8.35B | 6.58B | 5.65B | 5.72B | 5.76B | 5.87B | 5.15B | 4.78B | 4.36B | 4.03B | 3.80B | 3.90B | 3.11B | 2.51B | 2.35B | 1.81B | 1.30B | 1.11B | 0.00 | 0.00 | 0.00 | 0.00 | 0.00 | 0.00 | 0.00 | 0.00 | 0.00 |
| General & Administrative | 4.68B | 5.80B | 5.44B | 5.42B | 5.32B | 5.55B | 6.07B | 6.60B | 6.13B | 6.34B | 6.19B | 6.06B | 0.00 | 0.00 | 0.00 | 0.00 | 0.00 | 0.00 | 0.00 | 0.00 | 0.00 | 0.00 | 0.00 | 0.00 | 0.00 | 0.00 | 0.00 | 0.00 | 0.00 | 0.00 | 0.00 | 0.00 | 0.00 | 0.00 | 0.00 | 0.00 | 0.00 | 0.00 | 0.00 |
| Selling & Marketing | 950.00M | 1.20B | 1.10B | 763.00M | 832.00M | 1.20B | 1.40B | 1.80B | 1.80B | 1.80B | 1.90B | 2.00B | 0.00 | 6.31B | 0.00 | 0.00 | 0.00 | 0.00 | 0.00 | 0.00 | 0.00 | 0.00 | 0.00 | 0.00 | 0.00 | 0.00 | 0.00 | 0.00 | 0.00 | 0.00 | 0.00 | 0.00 | 0.00 | 0.00 | 0.00 | 0.00 | 0.00 | 0.00 | 0.00 |
| SG&A | 5.63B | 7.00B | 6.54B | 6.18B | 6.15B | 6.75B | 7.47B | 8.40B | 7.93B | 8.14B | 8.09B | 8.06B | 7.67B | 6.31B | 6.68B | 5.46B | 5.40B | 6.10B | 5.69B | 4.66B | 4.28B | 4.33B | 4.46B | 5.09B | 3.87B | 3.08B | 2.89B | 2.32B | 1.84B | 1.45B | 2.14B | 1.80B | 1.38B | 1.13B | 848.50M | 774.50M | 617.70M | 539.60M | 481.70M |
| Other Expenses | 0.00 | 0.00 | 2.63B | -147.00M | 490.00M | 156.00M | -30.00M | 67.00M | 108.00M | 94.00M | -11.00M | 87.00M | 0.00 | 0.00 | 0.00 | 0.00 | 0.00 | 0.00 | 0.00 | 0.00 | 0.00 | 0.00 | 0.00 | 0.00 | 0.00 | 0.00 | 0.00 | 0.00 | 0.00 | 0.00 | 0.00 | 0.00 | 0.00 | 0.00 | 0.00 | 0.00 | 0.00 | 0.00 | 0.00 |
| Operating Expenses | 21.68B | 24.53B | 21.73B | 19.74B | 19.71B | 20.49B | 20.75B | 21.43B | 20.32B | 19.97B | 18.99B | 18.51B | 16.28B | 12.90B | 13.62B | 11.67B | 11.40B | 12.01B | 10.96B | 9.62B | 9.56B | 8.92B | 10.60B | 10.57B | 7.39B | 5.59B | 5.24B | 4.13B | 3.14B | 2.56B | 2.86B | 2.31B | 1.80B | 1.43B | 1.09B | 985.40M | 789.10M | 713.10M | 648.00M |
| Cost & Expenses | 54.20B | 60.72B | 56.94B | 53.99B | 49.54B | 47.60B | 44.44B | 44.63B | 41.00B | 40.23B | 40.18B | 38.70B | 36.52B | 27.71B | 29.19B | 28.41B | 29.83B | 29.18B | 26.74B | 24.08B | 22.60B | 22.36B | 24.09B | 23.22B | 19.23B | 17.73B | 15.18B | 13.29B | 10.95B | 8.13B | 5.39B | 4.35B | 3.70B | 3.06B | 2.57B | 2.28B | 1.66B | 1.40B | 1.43B |
| Interest Income | 1.34B | 589.00M | 144.00M | 272.00M | 483.00M | 438.00M | 441.00M | 222.00M | 124.00M | 141.00M | 104.00M | 97.00M | 98.00M | 119.00M | 168.00M | 488.00M | 0.00 | 0.00 | 0.00 | 0.00 | 0.00 | 0.00 | 0.00 | 0.00 | 0.00 | 0.00 | 0.00 | 0.00 | 0.00 | 0.00 | 0.00 | 0.00 | 0.00 | 0.00 | 0.00 | 0.00 | 0.00 | 0.00 | 0.00 |
| Interest Expense | 878.00M | 496.00M | 597.00M | 629.00M | 489.00M | 468.00M | 646.00M | 733.00M | 337.00M | 192.00M | 244.00M | 90.00M | 41.00M | 10.00M | 1.00M | 8.00M | 0.00 | 0.00 | 0.00 | 0.00 | 0.00 | 0.00 | 0.00 | 0.00 | 0.00 | 0.00 | 0.00 | 0.00 | 0.00 | 0.00 | 0.00 | 0.00 | 0.00 | 0.00 | 0.00 | 0.00 | 0.00 | 0.00 | 0.00 |
| Depreciation & Amortization | 9.60B | 13.04B | 11.79B | 12.24B | 10.83B | 9.09B | 8.13B | 7.79B | 265.00M | 294.00M | 291.00M | 308.00M | 260.00M | 18.00M | 35.00M | 4.62B | 4.80B | 4.91B | 4.60B | 4.89B | 5.07B | 5.34B | 6.47B | 4.84B | 3.60B | 2.81B | 2.19B | 1.89B | 1.38B | 1.05B | 717.00M | 517.60M | 418.30M | 292.40M | 237.20M | 210.90M | 171.40M | 173.50M | 166.30M |
| EBITDA | 11.24B | 15.61B | 33.87B | 36.12B | 33.25B | 32.33B | 26.56B | 22.80B | 23.07B | 24.19B | 20.56B | 22.49B | 23.89B | 20.68B | 10.76B | 12.31B | 13.98B | 12.00B | 16.69B | 15.02B | 12.61B | 9.75B | 9.01B | 15.34B | 13.27B | 11.41B | 12.08B | 9.44B | 6.63B | 4.43B | 4.11B | 2.01B | 1.50B | 1.15B | 794.50M | 805.30M | 417.30M | 38.20M | 106.10M |
| EBITDA Ratio | 20.73% | 25.43% | 43.01% | 46.54% | 44.62% | 33.17% | 25.86% | 27.67% | 26.48% | 28.32% | 23.89% | 27.76% | 32.64% | 35.72% | 17.69% | 30.97% | 36.04% | 31.33% | 42.96% | 43.79% | 43.87% | 36.56% | 34.99% | 34.36% | 45.15% | 43.83% | 48.18% | 45.29% | 40.93% | 38.49% | 44.65% | 32.08% | 27.24% | 23.55% | 21.51% | 26.81% | 16.38% | 6.13% | 2.34% |
| Operating Income | 93.00M | 2.33B | 19.46B | 23.68B | 22.04B | 23.32B | 17.94B | 12.87B | 14.00B | 15.35B | 12.29B | 14.64B | 17.48B | 15.91B | 5.71B | 8.95B | 8.22B | 5.65B | 12.09B | 10.13B | 7.53B | 4.38B | 2.26B | 10.40B | 9.77B | 8.38B | 9.89B | 7.55B | 5.25B | 3.39B | 3.39B | 1.49B | 1.08B | 858.30M | 557.30M | 594.40M | 245.90M | -135.30M | -60.20M |
| Operating Income Ratio | 0.17% | 3.70% | 24.62% | 30.41% | 30.62% | 32.91% | 28.58% | 21.68% | 25.29% | 27.47% | 23.32% | 27.44% | 32.37% | 36.48% | 16.26% | 23.82% | 21.43% | 15.97% | 31.14% | 29.61% | 24.99% | 16.37% | 8.50% | 30.82% | 33.23% | 31.89% | 39.44% | 36.23% | 32.42% | 29.40% | 38.62% | 25.50% | 22.60% | 21.89% | 17.82% | 20.68% | 12.89% | -10.70% | -4.41% |
| Total Other Income/Expenses | 669.00M | 5.43B | 2.25B | 1.40B | 2.02B | 1.00M | 2.30B | -197.00M | 210.00M | 454.00M | 320.00M | 235.00M | 304.00M | 781.00M | -7.00M | -1.27B | 950.00M | 861.00M | 520.00M | 287.00M | -91.00M | -178.00M | -73.00M | 4.75B | 1.46B | 758.00M | 772.00M | 381.00M | 386.00M | 216.00M | 138.00M | 78.90M | 114.70M | 128.00M | 25.70M | 34.60M | 41.90M | -39.30M | 54.80M |
| Income Before Tax | 762.00M | 7.77B | 21.70B | 25.08B | 24.06B | 23.32B | 20.35B | 12.94B | 14.21B | 15.80B | 12.61B | 14.87B | 17.78B | 16.37B | 5.70B | 7.69B | 9.17B | 7.07B | 12.61B | 10.42B | 7.44B | 4.20B | 2.18B | 15.14B | 11.23B | 9.14B | 10.66B | 7.93B | 5.64B | 3.60B | 3.53B | 1.57B | 1.19B | 986.30M | 583.00M | 629.00M | 287.80M | -174.60M | -5.40M |
| Income Before Tax Ratio | 1.41% | 12.32% | 27.46% | 32.21% | 33.43% | 32.91% | 32.43% | 21.78% | 25.67% | 28.28% | 23.93% | 27.88% | 32.93% | 37.52% | 16.24% | 20.45% | 23.91% | 19.98% | 32.48% | 30.45% | 24.69% | 15.71% | 8.23% | 44.89% | 38.20% | 34.78% | 42.52% | 38.06% | 34.80% | 31.27% | 40.20% | 26.84% | 25.00% | 25.15% | 18.65% | 21.88% | 15.09% | -13.80% | -0.40% |
| Income Tax Expense | -913.00M | -249.00M | 1.84B | 4.18B | 3.01B | 2.26B | 10.75B | 2.62B | 2.79B | 4.10B | 2.99B | 3.87B | 4.84B | 4.70B | 1.34B | 2.39B | 2.19B | 2.02B | 3.95B | 2.90B | 1.80B | 1.09B | 892.00M | 4.61B | 3.91B | 3.07B | 3.71B | 2.78B | 2.07B | 1.32B | 1.24B | 502.00M | 376.00M | 336.00M | 192.00M | 176.10M | 112.30M | 8.70M | -7.00M |
| Net Income | 1.69B | 8.01B | 19.87B | 20.90B | 21.05B | 21.05B | 9.60B | 10.32B | 11.42B | 11.70B | 9.62B | 11.01B | 12.94B | 11.67B | 4.37B | 5.29B | 6.98B | 5.04B | 8.66B | 7.52B | 5.64B | 3.12B | 1.29B | 10.54B | 7.31B | 6.07B | 6.95B | 5.16B | 3.57B | 2.29B | 2.30B | 1.07B | 818.60M | 650.30M | 391.00M | 452.90M | 175.50M | -183.30M | 1.60M |
| Net Income Ratio | 3.11% | 12.71% | 25.14% | 26.84% | 29.25% | 29.72% | 15.30% | 17.37% | 20.63% | 20.95% | 18.25% | 20.63% | 23.97% | 26.76% | 12.44% | 14.08% | 18.20% | 14.26% | 22.31% | 21.97% | 18.72% | 11.65% | 4.86% | 31.24% | 24.89% | 23.10% | 27.70% | 24.74% | 22.01% | 19.86% | 26.13% | 18.25% | 17.13% | 16.58% | 12.50% | 15.75% | 9.20% | -14.49% | 0.12% |
| EPS | 0.40 | 1.95 | 4.89 | 4.98 | 4.77 | 4.57 | 2.04 | 2.18 | 2.41 | 2.39 | 1.94 | 2.20 | 2.46 | 2.10 | 0.79 | 0.93 | 1.20 | 0.87 | 1.42 | 1.17 | 0.86 | 0.47 | 0.19 | 1.57 | 1.10 | 0.91 | 1.07 | 0.79 | 0.54 | 0.35 | 0.35 | 0.16 | 0.13 | 0.11 | 0.07 | 0.09 | 0.04 | -0.04 | 0.01 |
| EPS Diluted | 0.40 | 1.94 | 4.86 | 4.94 | 4.71 | 4.48 | 1.99 | 2.12 | 2.33 | 2.31 | 1.89 | 2.13 | 2.39 | 2.05 | 0.77 | 0.92 | 1.18 | 0.86 | 1.40 | 1.16 | 0.85 | 0.46 | 0.19 | 1.51 | 1.05 | 0.87 | 0.97 | 0.73 | 0.51 | 0.33 | 0.33 | 0.16 | 0.13 | 0.10 | 0.07 | 0.08 | 0.04 | -0.04 | 0.01 |
| Weighted Avg Shares Out | 4.19B | 4.11B | 4.06B | 4.20B | 4.42B | 4.61B | 4.70B | 4.73B | 4.74B | 4.90B | 4.97B | 5.00B | 5.26B | 5.56B | 5.56B | 5.66B | 5.82B | 5.80B | 6.11B | 6.40B | 6.53B | 6.65B | 6.79B | 6.71B | 6.65B | 6.67B | 6.54B | 6.58B | 6.60B | 6.99B | 7.06B | 6.86B | 6.30B | 5.91B | 5.59B | 5.03B | 4.39B | 4.58B | 5.57B |
| Weighted Avg Shares Out (Dil) | 4.21B | 4.12B | 4.09B | 4.23B | 4.47B | 4.70B | 4.84B | 4.88B | 4.89B | 5.06B | 5.10B | 5.16B | 5.41B | 5.70B | 5.65B | 5.75B | 5.94B | 5.88B | 6.18B | 6.49B | 6.62B | 6.76B | 6.88B | 6.99B | 6.94B | 7.03B | 7.18B | 7.10B | 7.07B | 6.99B | 7.06B | 6.86B | 6.30B | 6.50B | 5.59B | 5.66B | 4.39B | 4.58B | 5.57B |

Intel's Next CEO? Why Apple, TSMC, Marvell Executives Could Be in the Mix.
Gelsinger Gone: What Intel's Big Move Means for INTC Stock
Departing Intel CEO Gets $10 Million
Intel Axes CEO Pat Gelsinger: Is It Time to Buy the Struggling Chip Stock?

2025: Intel Stock's Comeback Year?

5 Top Stocks to Buy in December

And the Winner Isn't—Behold Intel, CVS, and More of the Ugliest Turnaround Attempts of 2024
Intel's next CEO needs to decide the fate of its chip fabs
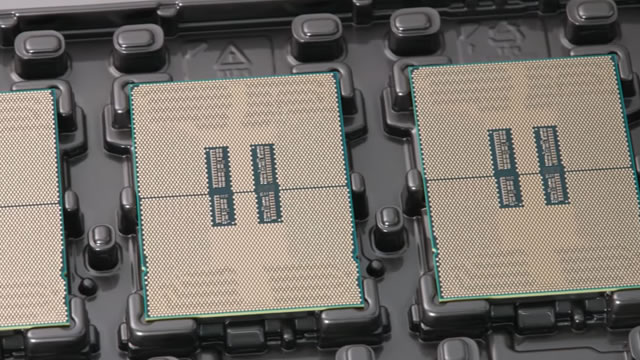
What's next for Intel's foundry business without Pat Gelsinger?
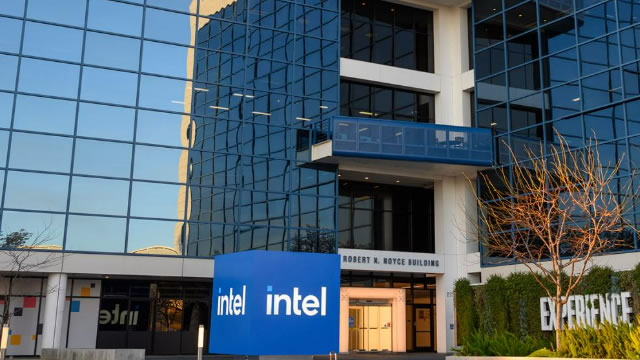
Intel: Pat's Away -- Reiterating Buy
Source: https://incomestatements.info
Category: Stock Reports
