See more : Smith & Wesson Brands, Inc. (0HEM.L) Income Statement Analysis – Financial Results
Complete financial analysis of Intel Corporation (INTC) income statement, including revenue, profit margins, EPS and key performance metrics. Get detailed insights into the financial performance of Intel Corporation, a leading company in the Semiconductors industry within the Technology sector.
- LARGAN Precision Co.,Ltd (3008.TW) Income Statement Analysis – Financial Results
- Public Joint-Stock Company Krasnyj Octyabr (KROTP.ME) Income Statement Analysis – Financial Results
- Shenzhen Success Electronics Co., Ltd (002289.SZ) Income Statement Analysis – Financial Results
- dynamic Archistructures Limite (DAL.BO) Income Statement Analysis – Financial Results
- Indian Renewable Energy Development Agency Limited (IREDA.BO) Income Statement Analysis – Financial Results
Intel Corporation (INTC)
About Intel Corporation
Intel Corporation engages in the design, manufacture, and sale of computer products and technologies worldwide. The company operates through CCG, DCG, IOTG, Mobileye, NSG, PSG, and All Other segments. It offers platform products, such as central processing units and chipsets, and system-on-chip and multichip packages; and non-platform or adjacent products, including accelerators, boards and systems, connectivity products, graphics, and memory and storage products. The company also provides high-performance compute solutions for targeted verticals and embedded applications for retail, industrial, and healthcare markets; and solutions for assisted and autonomous driving comprising compute platforms, computer vision and machine learning-based sensing, mapping and localization, driving policy, and active sensors. In addition, it offers workload-optimized platforms and related products for cloud service providers, enterprise and government, and communications service providers. The company serves original equipment manufacturers, original design manufacturers, and cloud service providers. Intel Corporation has a strategic partnership with MILA to develop and apply advances in artificial intelligence methods for enhancing the search in the space of drugs. The company was incorporated in 1968 and is headquartered in Santa Clara, California.
| Metric | 2023 | 2022 | 2021 | 2020 | 2019 | 2018 | 2017 | 2016 | 2015 | 2014 | 2013 | 2012 | 2011 | 2010 | 2009 | 2008 | 2007 | 2006 | 2005 | 2004 | 2003 | 2002 | 2001 | 2000 | 1999 | 1998 | 1997 | 1996 | 1995 | 1994 | 1993 | 1992 | 1991 | 1990 | 1989 | 1988 | 1987 | 1986 | 1985 |
|---|---|---|---|---|---|---|---|---|---|---|---|---|---|---|---|---|---|---|---|---|---|---|---|---|---|---|---|---|---|---|---|---|---|---|---|---|---|---|---|
| Revenue | 54.23B | 63.05B | 79.02B | 77.87B | 71.97B | 70.85B | 62.76B | 59.39B | 55.36B | 55.87B | 52.71B | 53.34B | 54.00B | 43.62B | 35.13B | 37.59B | 38.33B | 35.38B | 38.83B | 34.21B | 30.14B | 26.76B | 26.54B | 33.73B | 29.39B | 26.27B | 25.07B | 20.85B | 16.20B | 11.52B | 8.78B | 5.84B | 4.78B | 3.92B | 3.13B | 2.87B | 1.91B | 1.27B | 1.37B |
| Cost of Revenue | 32.52B | 36.19B | 35.21B | 34.26B | 29.83B | 27.11B | 23.69B | 23.20B | 20.68B | 20.26B | 21.19B | 20.19B | 20.24B | 14.81B | 15.57B | 16.74B | 18.43B | 17.16B | 15.78B | 14.46B | 13.05B | 13.45B | 13.49B | 12.65B | 11.84B | 12.14B | 9.95B | 9.16B | 7.81B | 5.58B | 2.54B | 2.04B | 1.90B | 1.64B | 1.48B | 1.30B | 872.10M | 687.20M | 777.20M |
| Gross Profit | 21.71B | 26.87B | 43.82B | 43.61B | 42.14B | 43.74B | 39.07B | 36.19B | 34.68B | 35.61B | 31.52B | 33.15B | 33.76B | 28.82B | 19.56B | 20.84B | 19.90B | 18.22B | 23.05B | 19.75B | 17.09B | 13.32B | 13.05B | 21.08B | 17.55B | 14.13B | 15.13B | 11.68B | 8.39B | 5.95B | 6.25B | 3.80B | 2.88B | 2.28B | 1.64B | 1.58B | 1.04B | 577.80M | 587.80M |
| Gross Profit Ratio | 40.04% | 42.61% | 55.45% | 56.01% | 58.56% | 61.73% | 62.25% | 60.94% | 62.65% | 63.74% | 59.80% | 62.15% | 62.51% | 66.05% | 55.69% | 55.46% | 51.92% | 51.49% | 59.36% | 57.72% | 56.71% | 49.76% | 49.18% | 62.49% | 59.73% | 53.78% | 60.33% | 56.04% | 51.79% | 51.60% | 71.13% | 65.10% | 60.30% | 58.23% | 52.55% | 54.95% | 54.27% | 45.68% | 43.06% |
| Research & Development | 16.05B | 17.53B | 15.19B | 13.56B | 13.36B | 13.54B | 13.10B | 12.74B | 12.13B | 11.54B | 10.61B | 10.15B | 8.35B | 6.58B | 5.65B | 5.72B | 5.76B | 5.87B | 5.15B | 4.78B | 4.36B | 4.03B | 3.80B | 3.90B | 3.11B | 2.51B | 2.35B | 1.81B | 1.30B | 1.11B | 0.00 | 0.00 | 0.00 | 0.00 | 0.00 | 0.00 | 0.00 | 0.00 | 0.00 |
| General & Administrative | 4.68B | 5.80B | 5.44B | 5.42B | 5.32B | 5.55B | 6.07B | 6.60B | 6.13B | 6.34B | 6.19B | 6.06B | 0.00 | 0.00 | 0.00 | 0.00 | 0.00 | 0.00 | 0.00 | 0.00 | 0.00 | 0.00 | 0.00 | 0.00 | 0.00 | 0.00 | 0.00 | 0.00 | 0.00 | 0.00 | 0.00 | 0.00 | 0.00 | 0.00 | 0.00 | 0.00 | 0.00 | 0.00 | 0.00 |
| Selling & Marketing | 950.00M | 1.20B | 1.10B | 763.00M | 832.00M | 1.20B | 1.40B | 1.80B | 1.80B | 1.80B | 1.90B | 2.00B | 0.00 | 6.31B | 0.00 | 0.00 | 0.00 | 0.00 | 0.00 | 0.00 | 0.00 | 0.00 | 0.00 | 0.00 | 0.00 | 0.00 | 0.00 | 0.00 | 0.00 | 0.00 | 0.00 | 0.00 | 0.00 | 0.00 | 0.00 | 0.00 | 0.00 | 0.00 | 0.00 |
| SG&A | 5.63B | 7.00B | 6.54B | 6.18B | 6.15B | 6.75B | 7.47B | 8.40B | 7.93B | 8.14B | 8.09B | 8.06B | 7.67B | 6.31B | 6.68B | 5.46B | 5.40B | 6.10B | 5.69B | 4.66B | 4.28B | 4.33B | 4.46B | 5.09B | 3.87B | 3.08B | 2.89B | 2.32B | 1.84B | 1.45B | 2.14B | 1.80B | 1.38B | 1.13B | 848.50M | 774.50M | 617.70M | 539.60M | 481.70M |
| Other Expenses | 0.00 | 0.00 | 2.63B | -147.00M | 490.00M | 156.00M | -30.00M | 67.00M | 108.00M | 94.00M | -11.00M | 87.00M | 0.00 | 0.00 | 0.00 | 0.00 | 0.00 | 0.00 | 0.00 | 0.00 | 0.00 | 0.00 | 0.00 | 0.00 | 0.00 | 0.00 | 0.00 | 0.00 | 0.00 | 0.00 | 0.00 | 0.00 | 0.00 | 0.00 | 0.00 | 0.00 | 0.00 | 0.00 | 0.00 |
| Operating Expenses | 21.68B | 24.53B | 21.73B | 19.74B | 19.71B | 20.49B | 20.75B | 21.43B | 20.32B | 19.97B | 18.99B | 18.51B | 16.28B | 12.90B | 13.62B | 11.67B | 11.40B | 12.01B | 10.96B | 9.62B | 9.56B | 8.92B | 10.60B | 10.57B | 7.39B | 5.59B | 5.24B | 4.13B | 3.14B | 2.56B | 2.86B | 2.31B | 1.80B | 1.43B | 1.09B | 985.40M | 789.10M | 713.10M | 648.00M |
| Cost & Expenses | 54.20B | 60.72B | 56.94B | 53.99B | 49.54B | 47.60B | 44.44B | 44.63B | 41.00B | 40.23B | 40.18B | 38.70B | 36.52B | 27.71B | 29.19B | 28.41B | 29.83B | 29.18B | 26.74B | 24.08B | 22.60B | 22.36B | 24.09B | 23.22B | 19.23B | 17.73B | 15.18B | 13.29B | 10.95B | 8.13B | 5.39B | 4.35B | 3.70B | 3.06B | 2.57B | 2.28B | 1.66B | 1.40B | 1.43B |
| Interest Income | 1.34B | 589.00M | 144.00M | 272.00M | 483.00M | 438.00M | 441.00M | 222.00M | 124.00M | 141.00M | 104.00M | 97.00M | 98.00M | 119.00M | 168.00M | 488.00M | 0.00 | 0.00 | 0.00 | 0.00 | 0.00 | 0.00 | 0.00 | 0.00 | 0.00 | 0.00 | 0.00 | 0.00 | 0.00 | 0.00 | 0.00 | 0.00 | 0.00 | 0.00 | 0.00 | 0.00 | 0.00 | 0.00 | 0.00 |
| Interest Expense | 878.00M | 496.00M | 597.00M | 629.00M | 489.00M | 468.00M | 646.00M | 733.00M | 337.00M | 192.00M | 244.00M | 90.00M | 41.00M | 10.00M | 1.00M | 8.00M | 0.00 | 0.00 | 0.00 | 0.00 | 0.00 | 0.00 | 0.00 | 0.00 | 0.00 | 0.00 | 0.00 | 0.00 | 0.00 | 0.00 | 0.00 | 0.00 | 0.00 | 0.00 | 0.00 | 0.00 | 0.00 | 0.00 | 0.00 |
| Depreciation & Amortization | 9.60B | 13.04B | 11.79B | 12.24B | 10.83B | 9.09B | 8.13B | 7.79B | 265.00M | 294.00M | 291.00M | 308.00M | 260.00M | 18.00M | 35.00M | 4.62B | 4.80B | 4.91B | 4.60B | 4.89B | 5.07B | 5.34B | 6.47B | 4.84B | 3.60B | 2.81B | 2.19B | 1.89B | 1.38B | 1.05B | 717.00M | 517.60M | 418.30M | 292.40M | 237.20M | 210.90M | 171.40M | 173.50M | 166.30M |
| EBITDA | 11.24B | 15.61B | 33.87B | 36.12B | 33.25B | 32.33B | 26.56B | 22.80B | 23.07B | 24.19B | 20.56B | 22.49B | 23.89B | 20.68B | 10.76B | 12.31B | 13.98B | 12.00B | 16.69B | 15.02B | 12.61B | 9.75B | 9.01B | 15.34B | 13.27B | 11.41B | 12.08B | 9.44B | 6.63B | 4.43B | 4.11B | 2.01B | 1.50B | 1.15B | 794.50M | 805.30M | 417.30M | 38.20M | 106.10M |
| EBITDA Ratio | 20.73% | 25.43% | 43.01% | 46.54% | 44.62% | 33.17% | 25.86% | 27.67% | 26.48% | 28.32% | 23.89% | 27.76% | 32.64% | 35.72% | 17.69% | 30.97% | 36.04% | 31.33% | 42.96% | 43.79% | 43.87% | 36.56% | 34.99% | 34.36% | 45.15% | 43.83% | 48.18% | 45.29% | 40.93% | 38.49% | 44.65% | 32.08% | 27.24% | 23.55% | 21.51% | 26.81% | 16.38% | 6.13% | 2.34% |
| Operating Income | 93.00M | 2.33B | 19.46B | 23.68B | 22.04B | 23.32B | 17.94B | 12.87B | 14.00B | 15.35B | 12.29B | 14.64B | 17.48B | 15.91B | 5.71B | 8.95B | 8.22B | 5.65B | 12.09B | 10.13B | 7.53B | 4.38B | 2.26B | 10.40B | 9.77B | 8.38B | 9.89B | 7.55B | 5.25B | 3.39B | 3.39B | 1.49B | 1.08B | 858.30M | 557.30M | 594.40M | 245.90M | -135.30M | -60.20M |
| Operating Income Ratio | 0.17% | 3.70% | 24.62% | 30.41% | 30.62% | 32.91% | 28.58% | 21.68% | 25.29% | 27.47% | 23.32% | 27.44% | 32.37% | 36.48% | 16.26% | 23.82% | 21.43% | 15.97% | 31.14% | 29.61% | 24.99% | 16.37% | 8.50% | 30.82% | 33.23% | 31.89% | 39.44% | 36.23% | 32.42% | 29.40% | 38.62% | 25.50% | 22.60% | 21.89% | 17.82% | 20.68% | 12.89% | -10.70% | -4.41% |
| Total Other Income/Expenses | 669.00M | 5.43B | 2.25B | 1.40B | 2.02B | 1.00M | 2.30B | -197.00M | 210.00M | 454.00M | 320.00M | 235.00M | 304.00M | 781.00M | -7.00M | -1.27B | 950.00M | 861.00M | 520.00M | 287.00M | -91.00M | -178.00M | -73.00M | 4.75B | 1.46B | 758.00M | 772.00M | 381.00M | 386.00M | 216.00M | 138.00M | 78.90M | 114.70M | 128.00M | 25.70M | 34.60M | 41.90M | -39.30M | 54.80M |
| Income Before Tax | 762.00M | 7.77B | 21.70B | 25.08B | 24.06B | 23.32B | 20.35B | 12.94B | 14.21B | 15.80B | 12.61B | 14.87B | 17.78B | 16.37B | 5.70B | 7.69B | 9.17B | 7.07B | 12.61B | 10.42B | 7.44B | 4.20B | 2.18B | 15.14B | 11.23B | 9.14B | 10.66B | 7.93B | 5.64B | 3.60B | 3.53B | 1.57B | 1.19B | 986.30M | 583.00M | 629.00M | 287.80M | -174.60M | -5.40M |
| Income Before Tax Ratio | 1.41% | 12.32% | 27.46% | 32.21% | 33.43% | 32.91% | 32.43% | 21.78% | 25.67% | 28.28% | 23.93% | 27.88% | 32.93% | 37.52% | 16.24% | 20.45% | 23.91% | 19.98% | 32.48% | 30.45% | 24.69% | 15.71% | 8.23% | 44.89% | 38.20% | 34.78% | 42.52% | 38.06% | 34.80% | 31.27% | 40.20% | 26.84% | 25.00% | 25.15% | 18.65% | 21.88% | 15.09% | -13.80% | -0.40% |
| Income Tax Expense | -913.00M | -249.00M | 1.84B | 4.18B | 3.01B | 2.26B | 10.75B | 2.62B | 2.79B | 4.10B | 2.99B | 3.87B | 4.84B | 4.70B | 1.34B | 2.39B | 2.19B | 2.02B | 3.95B | 2.90B | 1.80B | 1.09B | 892.00M | 4.61B | 3.91B | 3.07B | 3.71B | 2.78B | 2.07B | 1.32B | 1.24B | 502.00M | 376.00M | 336.00M | 192.00M | 176.10M | 112.30M | 8.70M | -7.00M |
| Net Income | 1.69B | 8.01B | 19.87B | 20.90B | 21.05B | 21.05B | 9.60B | 10.32B | 11.42B | 11.70B | 9.62B | 11.01B | 12.94B | 11.67B | 4.37B | 5.29B | 6.98B | 5.04B | 8.66B | 7.52B | 5.64B | 3.12B | 1.29B | 10.54B | 7.31B | 6.07B | 6.95B | 5.16B | 3.57B | 2.29B | 2.30B | 1.07B | 818.60M | 650.30M | 391.00M | 452.90M | 175.50M | -183.30M | 1.60M |
| Net Income Ratio | 3.11% | 12.71% | 25.14% | 26.84% | 29.25% | 29.72% | 15.30% | 17.37% | 20.63% | 20.95% | 18.25% | 20.63% | 23.97% | 26.76% | 12.44% | 14.08% | 18.20% | 14.26% | 22.31% | 21.97% | 18.72% | 11.65% | 4.86% | 31.24% | 24.89% | 23.10% | 27.70% | 24.74% | 22.01% | 19.86% | 26.13% | 18.25% | 17.13% | 16.58% | 12.50% | 15.75% | 9.20% | -14.49% | 0.12% |
| EPS | 0.40 | 1.95 | 4.89 | 4.98 | 4.77 | 4.57 | 2.04 | 2.18 | 2.41 | 2.39 | 1.94 | 2.20 | 2.46 | 2.10 | 0.79 | 0.93 | 1.20 | 0.87 | 1.42 | 1.17 | 0.86 | 0.47 | 0.19 | 1.57 | 1.10 | 0.91 | 1.07 | 0.79 | 0.54 | 0.35 | 0.35 | 0.16 | 0.13 | 0.11 | 0.07 | 0.09 | 0.04 | -0.04 | 0.01 |
| EPS Diluted | 0.40 | 1.94 | 4.86 | 4.94 | 4.71 | 4.48 | 1.99 | 2.12 | 2.33 | 2.31 | 1.89 | 2.13 | 2.39 | 2.05 | 0.77 | 0.92 | 1.18 | 0.86 | 1.40 | 1.16 | 0.85 | 0.46 | 0.19 | 1.51 | 1.05 | 0.87 | 0.97 | 0.73 | 0.51 | 0.33 | 0.33 | 0.16 | 0.13 | 0.10 | 0.07 | 0.08 | 0.04 | -0.04 | 0.01 |
| Weighted Avg Shares Out | 4.19B | 4.11B | 4.06B | 4.20B | 4.42B | 4.61B | 4.70B | 4.73B | 4.74B | 4.90B | 4.97B | 5.00B | 5.26B | 5.56B | 5.56B | 5.66B | 5.82B | 5.80B | 6.11B | 6.40B | 6.53B | 6.65B | 6.79B | 6.71B | 6.65B | 6.67B | 6.54B | 6.58B | 6.60B | 6.99B | 7.06B | 6.86B | 6.30B | 5.91B | 5.59B | 5.03B | 4.39B | 4.58B | 5.57B |
| Weighted Avg Shares Out (Dil) | 4.21B | 4.12B | 4.09B | 4.23B | 4.47B | 4.70B | 4.84B | 4.88B | 4.89B | 5.06B | 5.10B | 5.16B | 5.41B | 5.70B | 5.65B | 5.75B | 5.94B | 5.88B | 6.18B | 6.49B | 6.62B | 6.76B | 6.88B | 6.99B | 6.94B | 7.03B | 7.18B | 7.10B | 7.07B | 6.99B | 7.06B | 6.86B | 6.30B | 6.50B | 5.59B | 5.66B | 4.39B | 4.58B | 5.57B |
Intel shares rise as Pat Gelsinger unexpectedly exits CEO role
Intel CEO Gelsinger's removal raises doubts over turnaround plan
Are Intel's Problems Too Big to Fix?
Old CEO Out, 'New CEO' In - Struggling Intel Is A Bargain Nonetheless
Intel CEO stepping down is a good indication they will pursue a 'fabless model': Analyst

Intel CEO Pat Gelsinger's sudden exit: what's next for the American chipmaking giant?
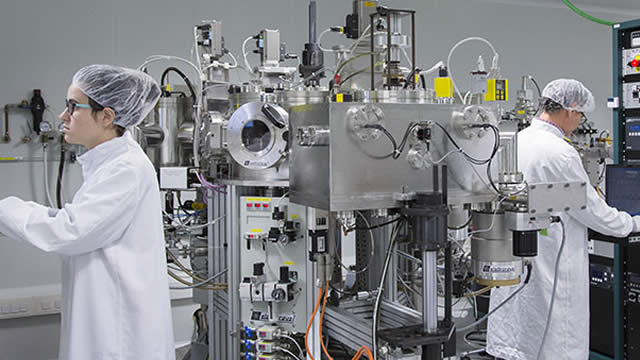
TSMC buying or running Intel's fabs is 'incredibly speculative at best': Daniel Newman
In an all-hands meeting, Intel's new leaders emphasized outgoing CEO Pat Gelsinger's 'personal decision'
The 'Fast Money' traders talk what's ahead for Intel

Intel's path forward 'is to break the company into two', says Susquehanna's Chris Rolland
Source: https://incomestatements.info
Category: Stock Reports
