See more : New Hope Corporation Limited (NHC.AX) Income Statement Analysis – Financial Results
Complete financial analysis of MAG Silver Corp. (MAG) income statement, including revenue, profit margins, EPS and key performance metrics. Get detailed insights into the financial performance of MAG Silver Corp., a leading company in the Silver industry within the Basic Materials sector.
- Burkhalter Holding AG (BRKN.SW) Income Statement Analysis – Financial Results
- Guobang Pharma Ltd. (605507.SS) Income Statement Analysis – Financial Results
- United Spirits Limited (UNITDSPR.BO) Income Statement Analysis – Financial Results
- LARK Distilling Co. Ltd. (LRKKF) Income Statement Analysis – Financial Results
- Procter & Gamble Hygiene and Health Care Limited (PGHH.BO) Income Statement Analysis – Financial Results
MAG Silver Corp. (MAG)
About MAG Silver Corp.
MAG Silver Corp. engages in the exploration and development of precious metal mining properties. The company explores for silver, gold, lead, and zinc deposits. It primarily holds 44% interest in the Juanicipio project located in the Fresnillo District, Zacatecas State, Mexico. The company is headquartered in Vancouver, Canada.
| Metric | 2023 | 2022 | 2021 | 2020 | 2019 | 2018 | 2017 | 2016 | 2015 | 2014 | 2013 | 2012 | 2011 | 2010 | 2009 | 2008 | 2007 | 2006 | 2005 | 2004 | 2003 | 2002 | 2001 |
|---|---|---|---|---|---|---|---|---|---|---|---|---|---|---|---|---|---|---|---|---|---|---|---|
| Revenue | 0.00 | 0.00 | 0.00 | 0.00 | 0.00 | 0.00 | 0.00 | 0.00 | 0.00 | 0.00 | 0.00 | 0.00 | 0.00 | 0.00 | 0.00 | 0.00 | 0.00 | 0.00 | 0.00 | 0.00 | 0.00 | 0.00 | 0.00 |
| Cost of Revenue | 358.46K | 130.61K | 146.00K | 121.00K | 106.00K | 15.00K | 20.00K | 23.00K | 16.24K | 35.19K | 35.75K | 44.30K | 0.00 | 0.00 | 0.00 | 0.00 | 0.00 | 0.00 | 0.00 | 0.00 | 0.00 | 0.00 | 0.00 |
| Gross Profit | -358.46K | -130.61K | -146.00K | -121.00K | -106.00K | -15.00K | -20.00K | -23.00K | -16.24K | -35.19K | -35.75K | -44.30K | 0.00 | 0.00 | 0.00 | 0.00 | 0.00 | 0.00 | 0.00 | 0.00 | 0.00 | 0.00 | 0.00 |
| Gross Profit Ratio | 0.00% | 0.00% | 0.00% | 0.00% | 0.00% | 0.00% | 0.00% | 0.00% | 0.00% | 0.00% | 0.00% | 0.00% | 0.00% | 0.00% | 0.00% | 0.00% | 0.00% | 0.00% | 0.00% | 0.00% | 0.00% | 0.00% | 0.00% |
| Research & Development | 0.00 | 0.00 | 0.00 | 0.00 | 0.00 | 0.00 | 0.00 | 0.00 | 0.00 | 0.00 | 0.00 | 0.00 | 0.00 | 0.00 | 0.00 | 0.00 | 0.00 | 0.00 | 0.00 | 0.00 | 0.00 | 0.00 | 0.00 |
| General & Administrative | 13.59M | 12.22M | 11.22M | 8.93M | 8.33M | 7.67M | 7.41M | 7.20M | 7.52M | 9.00M | 7.67M | 10.08M | 8.74M | 10.48M | 8.95M | 5.47M | 0.00 | 0.00 | 0.00 | 0.00 | 0.00 | 0.00 | 0.00 |
| Selling & Marketing | 736.00K | 0.00 | 0.00 | 0.00 | 0.00 | 0.00 | 0.00 | 0.00 | 0.00 | 0.00 | 0.00 | 0.00 | 0.00 | 0.00 | 0.00 | 0.00 | 0.00 | 0.00 | 0.00 | 0.00 | 0.00 | 0.00 | 0.00 |
| SG&A | 14.33M | 12.22M | 11.22M | 8.93M | 8.33M | 7.67M | 7.41M | 7.20M | 7.52M | 9.00M | 7.67M | 10.08M | 8.74M | 10.48M | 8.95M | 5.47M | 8.10M | 3.47M | 1.59M | 613.87K | 691.61K | 78.47K | 0.00 |
| Other Expenses | -65.10M | 329.00K | 102.00K | 38.00K | 577.00K | 1.12M | 1.09M | 257.00K | 216.66K | 0.00 | 354.58K | 0.00 | 59.57K | 76.75K | 662.28K | -40.44K | 14.05K | 14.43K | 15.81K | 9.62K | 1.44K | 0.00 | 181.19K |
| Operating Expenses | -50.77M | 12.55M | 11.32M | 8.97M | 8.90M | 8.79M | 8.50M | 7.45M | 7.73M | 9.00M | 8.03M | 10.08M | 8.80M | 10.55M | 9.61M | 5.43M | 8.12M | 3.48M | 1.60M | 623.49K | 693.05K | 78.47K | 181.19K |
| Cost & Expenses | -50.77M | 12.55M | 11.46M | 9.09M | 9.01M | 8.81M | 8.52M | 7.48M | 7.75M | 9.03M | 8.06M | 10.13M | 8.80M | 10.55M | 9.61M | 5.43M | 8.12M | 3.48M | 1.60M | 623.49K | 693.05K | 78.47K | 181.19K |
| Interest Income | 2.64M | 630.00K | 174.00K | 637.00K | 2.63M | 3.12M | 1.76M | 1.12M | 289.25K | 237.64K | 176.00K | 213.74K | 495.81K | 322.35K | 285.08K | 1.61M | 0.00 | 178.96K | 69.25K | 0.00 | 59.74K | 0.00 | 0.00 |
| Interest Expense | 0.00 | 0.00 | 57.49K | 67.38K | 68.56K | 0.00 | 0.00 | 0.00 | 0.00 | 0.00 | 48.67M | 0.00 | 0.00 | 0.00 | 3.14K | 2.75K | 0.00 | 1.90K | 1.57K | 0.00 | 12.56K | 0.00 | 0.00 |
| Depreciation & Amortization | 358.46K | 130.61K | 144.72K | 127.39K | 108.46K | 14.24K | 20.72K | 22.72K | 16.24K | 35.19K | 35.75K | 44.30K | 59.57K | 76.75K | 70.36K | 32.82K | 14.05K | 14.43K | 15.81K | 9.62K | 1.44K | 574.86 | 5.53K |
| EBITDA | -13.98M | -21.68M | -11.35M | -8.53M | -6.41M | -4.95M | -6.27M | -58.36M | -12.86M | -15.66M | -7.48M | -13.16M | -7.21M | -12.60M | -12.80M | -4.72M | -8.24M | -3.31M | -1.53M | -600.35K | 0.00 | -78.47K | -181.19K |
| EBITDA Ratio | 0.00% | 0.00% | 0.00% | 0.00% | 0.00% | 0.00% | 0.00% | 0.00% | 0.00% | 0.00% | 0.00% | 0.00% | 0.00% | 0.00% | 0.00% | 0.00% | 0.00% | 0.00% | 0.00% | 0.00% | 0.00% | 0.00% | 0.00% |
| Operating Income | 50.77M | 17.75M | -11.52M | -9.26M | -8.95M | -5.01M | -5.77M | -60.42M | -15.35M | -16.69M | 23.53M | -13.15M | -7.25M | -12.82M | -12.88M | -4.82M | -8.23M | 3.48M | 1.60M | -610.49K | 693.05K | -78.47K | -181.19K |
| Operating Income Ratio | 0.00% | 0.00% | 0.00% | 0.00% | 0.00% | 0.00% | 0.00% | 0.00% | 0.00% | 0.00% | 0.00% | 0.00% | 0.00% | 0.00% | 0.00% | 0.00% | 0.00% | 0.00% | 0.00% | 0.00% | 0.00% | 0.00% | 0.00% |
| Total Other Income/Expenses | 3.47M | 264.00K | 15.98M | 2.24M | 3.00M | 1.96M | 814.00K | -53.92M | -8.32M | -8.23M | -17.66M | -3.04M | 1.55M | -2.20M | -3.85M | 677.94K | -109.86K | 6.96M | 3.22M | 13.04K | 0.00 | 0.00 | 0.00 |
| Income Before Tax | 54.24M | 18.02M | 4.46M | -6.07M | -4.56M | -5.01M | -5.77M | -60.42M | -15.35M | -16.69M | -25.14M | -13.15M | -7.25M | -12.82M | -16.43M | -5.83M | -10.03M | 3.47M | 1.58M | -650.71K | 0.00 | 0.00 | 0.00 |
| Income Before Tax Ratio | 0.00% | 0.00% | 0.00% | 0.00% | 0.00% | 0.00% | 0.00% | 0.00% | 0.00% | 0.00% | 0.00% | 0.00% | 0.00% | 0.00% | 0.00% | 0.00% | 0.00% | 0.00% | 0.00% | 0.00% | 0.00% | 0.00% | 0.00% |
| Income Tax Expense | 5.58M | 371.00K | -1.57M | 1.03M | -131.00K | 796.00K | 728.00K | -4.58M | 1.48M | -552.38K | 4.23M | -840.05K | 836.75K | 2.27M | 3.14K | 2.75K | 111.98K | 6.80M | 3.16M | -13.00K | 1.34M | -574.86 | -5.53K |
| Net Income | 48.66M | 17.64M | 6.03M | -7.10M | -4.43M | -5.80M | -6.50M | -55.85M | -16.83M | -16.13M | -29.37M | -12.31M | -8.09M | -12.82M | -12.88M | -4.83M | -8.23M | -3.32M | -1.56M | -610.49K | -645.87K | -77.90K | -175.65K |
| Net Income Ratio | 0.00% | 0.00% | 0.00% | 0.00% | 0.00% | 0.00% | 0.00% | 0.00% | 0.00% | 0.00% | 0.00% | 0.00% | 0.00% | 0.00% | 0.00% | 0.00% | 0.00% | 0.00% | 0.00% | 0.00% | 0.00% | 0.00% | 0.00% |
| EPS | 0.47 | 0.17 | 0.06 | -0.08 | -0.05 | -0.07 | -0.08 | -0.71 | -0.24 | -0.25 | -0.49 | -0.22 | -0.15 | -0.24 | -0.26 | -0.10 | -0.19 | -0.09 | -0.06 | -0.02 | -0.04 | -0.02 | -0.06 |
| EPS Diluted | 0.47 | 0.17 | 0.06 | -0.08 | -0.05 | -0.07 | -0.08 | -0.71 | -0.24 | -0.25 | -0.49 | -0.22 | -0.15 | -0.24 | -0.26 | -0.10 | -0.19 | -0.09 | -0.06 | -0.02 | -0.04 | -0.02 | -0.06 |
| Weighted Avg Shares Out | 103.53M | 98.42M | 95.18M | 91.11M | 86.14M | 85.52M | 81.18M | 78.48M | 69.21M | 64.11M | 60.13M | 57.08M | 55.47M | 52.86M | 49.25M | 48.79M | 42.41M | 37.06M | 28.35M | 24.58M | 14.46M | 3.49M | 3.00M |
| Weighted Avg Shares Out (Dil) | 102.63M | 98.56M | 95.46M | 91.11M | 86.14M | 85.52M | 81.18M | 78.48M | 69.21M | 64.11M | 60.13M | 57.08M | 55.47M | 52.86M | 49.25M | 48.79M | 42.41M | 37.06M | 28.35M | 25.57M | 14.46M | 3.49M | 3.00M |
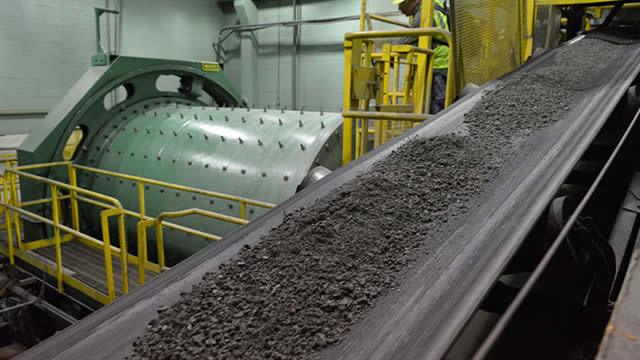
MAG Silver: Record Adjusted EBITDA In Q3, But Still No Shareholder Distributions

MAG Silver Reports Third Quarter Financial Results

Are You Looking for a Top Momentum Pick? Why MAG Silver (MAG) is a Great Choice
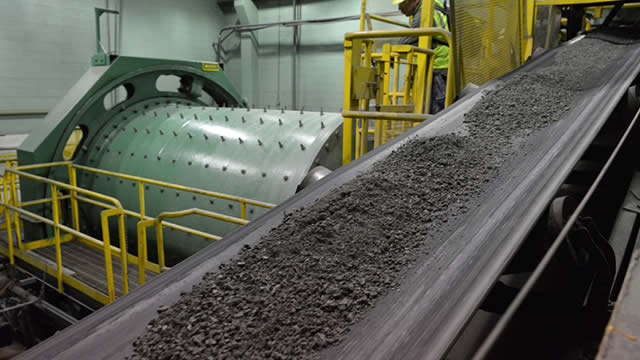
Are Basic Materials Stocks Lagging MAG Silver (MAG) This Year?
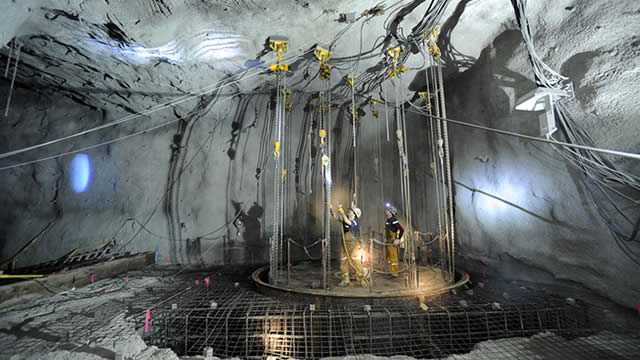
MAG Silver (MAG) Upgraded to Strong Buy: Here's Why

MAG Announces Third Quarter 2024 Production from Juanicipio

3 Strong Buy Breakout Stocks for Attractive Returns
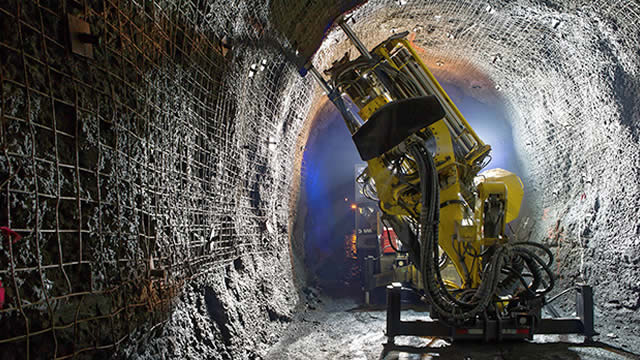
Is MAG Silver (MAG) Stock Outpacing Its Basic Materials Peers This Year?

MAG Silver (MAG) is a Great Momentum Stock: Should You Buy?

MAG Aerospace Partners with Zapata AI to Deliver Next-Generation Airborne Surveillance Platform
Source: https://incomestatements.info
Category: Stock Reports
