See more : Container Corporation of India Limited (CONCOR.BO) Income Statement Analysis – Financial Results
Complete financial analysis of MasterBrand, Inc. (MBC) income statement, including revenue, profit margins, EPS and key performance metrics. Get detailed insights into the financial performance of MasterBrand, Inc., a leading company in the Furnishings, Fixtures & Appliances industry within the Consumer Cyclical sector.
- KNR Constructions Limited (KNRCON.BO) Income Statement Analysis – Financial Results
- KBS India Limited (KBSINDIA.BO) Income Statement Analysis – Financial Results
- Yunnan Yunwei Company Limited (600725.SS) Income Statement Analysis – Financial Results
- Caisse Régionale de Crédit Agricole Mutuel de La Touraine et du Poitou Société Coopérative (CRTO.PA) Income Statement Analysis – Financial Results
- First National Bank Alaska (FBAK) Income Statement Analysis – Financial Results
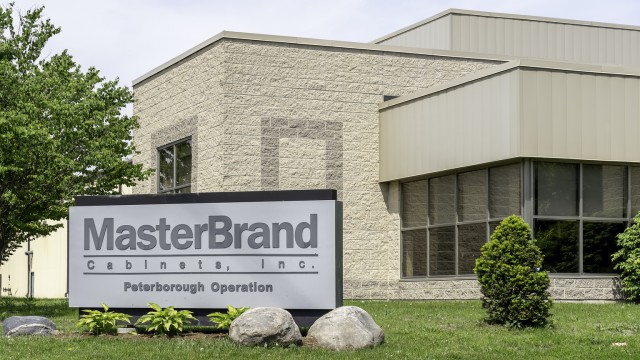
MasterBrand, Inc. (MBC)
Industry: Furnishings, Fixtures & Appliances
Sector: Consumer Cyclical
Website: https://www.masterbrandcabinets.com
About MasterBrand, Inc.
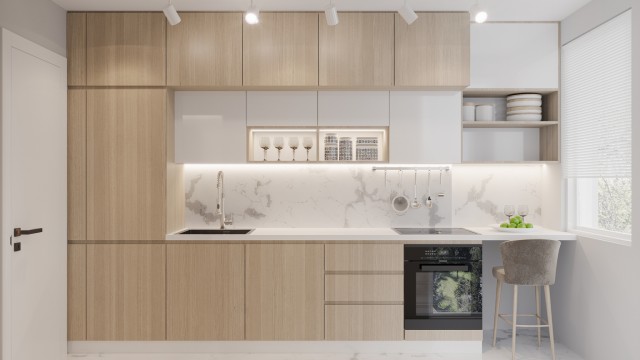
MasterBrand, Inc. manufactures and sells residential cabinets for the kitchen, bathroom, and other parts of the home in North America. The company is based in Jasper, Indiana.
| Metric | 2023 | 2022 | 2021 | 2020 | 2019 |
|---|---|---|---|---|---|
| Revenue | 2.73B | 3.28B | 2.86B | 2.47B | 2.39B |
| Cost of Revenue | 1.85B | 2.34B | 2.07B | 1.77B | 1.70B |
| Gross Profit | 875.90M | 940.50M | 783.90M | 703.00M | 691.80M |
| Gross Profit Ratio | 32.13% | 28.71% | 27.45% | 28.47% | 28.96% |
| Research & Development | 0.00 | 0.00 | 1.60M | 1.40M | 1.50M |
| General & Administrative | 532.80M | 647.20M | 525.60M | 474.20M | 0.00 |
| Selling & Marketing | 37.40M | 1.30M | 2.00M | 0.00 | 0.00 |
| SG&A | 572.60M | 648.50M | 527.60M | 474.20M | 477.80M |
| Other Expenses | 0.00 | 17.20M | 17.80M | 17.80M | 17.80M |
| Operating Expenses | 569.70M | 665.70M | 545.40M | 492.00M | 495.60M |
| Cost & Expenses | 2.42B | 3.00B | 2.62B | 2.26B | 2.19B |
| Interest Income | 0.00 | 12.90M | 4.60M | 2.40M | 100.00K |
| Interest Expense | 65.20M | 2.20M | 0.00 | 0.00 | 0.00 |
| Depreciation & Amortization | 64.30M | 64.50M | 75.10M | 77.50M | 75.00M |
| EBITDA | 368.20M | 356.00M | 313.40M | 273.70M | 210.20M |
| EBITDA Ratio | 13.51% | 10.73% | 10.70% | 11.29% | 12.99% |
| Operating Income | 306.30M | 287.10M | 234.30M | 196.00M | 247.90M |
| Operating Income Ratio | 11.24% | 8.77% | 8.21% | 7.94% | 10.38% |
| Total Other Income/Expenses | -67.60M | 10.10M | 4.00M | 200.00K | -9.30M |
| Income Before Tax | 238.70M | 213.40M | 238.30M | 196.20M | 135.20M |
| Income Before Tax Ratio | 8.76% | 6.52% | 8.35% | 7.95% | 5.66% |
| Income Tax Expense | 56.70M | 58.00M | 55.70M | 50.50M | 34.50M |
| Net Income | 182.00M | 155.40M | 182.60M | 145.70M | 100.70M |
| Net Income Ratio | 6.68% | 4.74% | 6.40% | 5.90% | 4.22% |
| EPS | 1.42 | 1.21 | 1.43 | 1.14 | 0.79 |
| EPS Diluted | 1.40 | 1.20 | 1.43 | 1.14 | 0.79 |
| Weighted Avg Shares Out | 127.80M | 128.00M | 128.02M | 128.02M | 128.02M |
| Weighted Avg Shares Out (Dil) | 129.90M | 129.10M | 128.02M | 128.02M | 128.02M |

MasterBrand to Announce Third Quarter 2023 Results on November 7

MasterBrand: Good Long-Term Prospects At An Attractive Valuation

MasterBrand Announces Participation in Habitat for Humanity's 37th Carter Work Project

MasterBrand Announces Participation in Zelman's 2023 Virtual Housing Summit

MasterBrand Named as One of America's Safest Companies by EHS Today

MasterBrand, Inc. (MBC) Q2 2023 Earnings Call Transcript

MasterBrand Reports Second Quarter 2023 Financial Results

MasterBrand: Good Execution And End Markets Bottoming Make It A Buy

MasterBrand to Announce Second Quarter 2023 Results on August 8

GCC $10.68 Bn Electric Vehicle Markets, Competition, Forecast & Opportunities, 2018-2022 & 2023-2028F - ResearchAndMarkets.com
Source: https://incomestatements.info
Category: Stock Reports
