See more : V.R. Woodart Limited (VRWODAR.BO) Income Statement Analysis – Financial Results
Complete financial analysis of MasterBrand, Inc. (MBC) income statement, including revenue, profit margins, EPS and key performance metrics. Get detailed insights into the financial performance of MasterBrand, Inc., a leading company in the Furnishings, Fixtures & Appliances industry within the Consumer Cyclical sector.
- Silver Hammer Mining Corp. (HAMRF) Income Statement Analysis – Financial Results
- Shanghai Yaohua Pilkington Glass Group Co., Ltd. (600819.SS) Income Statement Analysis – Financial Results
- Doha Insurance Group Q.P.S.C. (DOHI.QA) Income Statement Analysis – Financial Results
- HF Sinclair Corporation (DINO) Income Statement Analysis – Financial Results
- Aviva PLC (AV-B.L) Income Statement Analysis – Financial Results
MasterBrand, Inc. (MBC)
Industry: Furnishings, Fixtures & Appliances
Sector: Consumer Cyclical
Website: https://www.masterbrandcabinets.com
About MasterBrand, Inc.
MasterBrand, Inc. manufactures and sells residential cabinets for the kitchen, bathroom, and other parts of the home in North America. The company is based in Jasper, Indiana.
| Metric | 2023 | 2022 | 2021 | 2020 | 2019 |
|---|---|---|---|---|---|
| Revenue | 2.73B | 3.28B | 2.86B | 2.47B | 2.39B |
| Cost of Revenue | 1.85B | 2.34B | 2.07B | 1.77B | 1.70B |
| Gross Profit | 875.90M | 940.50M | 783.90M | 703.00M | 691.80M |
| Gross Profit Ratio | 32.13% | 28.71% | 27.45% | 28.47% | 28.96% |
| Research & Development | 0.00 | 0.00 | 1.60M | 1.40M | 1.50M |
| General & Administrative | 532.80M | 647.20M | 525.60M | 474.20M | 0.00 |
| Selling & Marketing | 37.40M | 1.30M | 2.00M | 0.00 | 0.00 |
| SG&A | 572.60M | 648.50M | 527.60M | 474.20M | 477.80M |
| Other Expenses | 0.00 | 17.20M | 17.80M | 17.80M | 17.80M |
| Operating Expenses | 569.70M | 665.70M | 545.40M | 492.00M | 495.60M |
| Cost & Expenses | 2.42B | 3.00B | 2.62B | 2.26B | 2.19B |
| Interest Income | 0.00 | 12.90M | 4.60M | 2.40M | 100.00K |
| Interest Expense | 65.20M | 2.20M | 0.00 | 0.00 | 0.00 |
| Depreciation & Amortization | 64.30M | 64.50M | 75.10M | 77.50M | 75.00M |
| EBITDA | 368.20M | 356.00M | 313.40M | 273.70M | 210.20M |
| EBITDA Ratio | 13.51% | 10.73% | 10.70% | 11.29% | 12.99% |
| Operating Income | 306.30M | 287.10M | 234.30M | 196.00M | 247.90M |
| Operating Income Ratio | 11.24% | 8.77% | 8.21% | 7.94% | 10.38% |
| Total Other Income/Expenses | -67.60M | 10.10M | 4.00M | 200.00K | -9.30M |
| Income Before Tax | 238.70M | 213.40M | 238.30M | 196.20M | 135.20M |
| Income Before Tax Ratio | 8.76% | 6.52% | 8.35% | 7.95% | 5.66% |
| Income Tax Expense | 56.70M | 58.00M | 55.70M | 50.50M | 34.50M |
| Net Income | 182.00M | 155.40M | 182.60M | 145.70M | 100.70M |
| Net Income Ratio | 6.68% | 4.74% | 6.40% | 5.90% | 4.22% |
| EPS | 1.42 | 1.21 | 1.43 | 1.14 | 0.79 |
| EPS Diluted | 1.40 | 1.20 | 1.43 | 1.14 | 0.79 |
| Weighted Avg Shares Out | 127.80M | 128.00M | 128.02M | 128.02M | 128.02M |
| Weighted Avg Shares Out (Dil) | 129.90M | 129.10M | 128.02M | 128.02M | 128.02M |
Gilead and Kite Oncology to Showcase Advances Across the Pipeline Aiming to Address Unmet Needs in Cancer Care at ASCO 2023

MasterBrand, Inc. (MBC) Q1 2023 Earnings Call Transcript

MasterBrand Reports First Quarter 2023 Financial Results

Menarini Group Announces New Data on Elacestrant at 2023 ESMO Breast Cancer Congress and 2023 ASCO Annual Meeting

Greenspace Health Launches Assessments Hub to Support Clinical Leaders and Clinicians Implementing Evidence-Based Assessments

Encompass Community Services Partners With Greenspace Health to Help Drive Program Equity for All Clients

MasterBrand to Announce First Quarter 2023 Results on May 9

Real Matters Announces CFO Transition
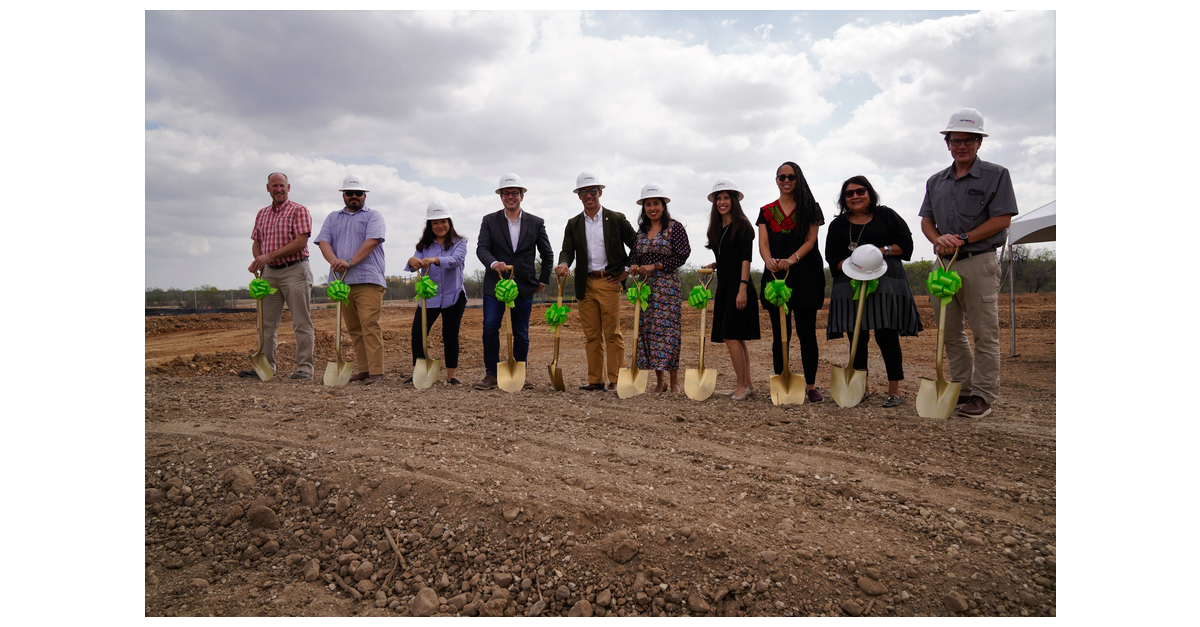
Voter-Approved Affordable Housing Bond Project Breaks Ground on the City’s South Side
KOCOWA+ Joins Verizon’s +play Platform
Source: https://incomestatements.info
Category: Stock Reports
