See more : Whitbread plc (WTB.L) Income Statement Analysis – Financial Results
Complete financial analysis of MasterBrand, Inc. (MBC) income statement, including revenue, profit margins, EPS and key performance metrics. Get detailed insights into the financial performance of MasterBrand, Inc., a leading company in the Furnishings, Fixtures & Appliances industry within the Consumer Cyclical sector.
- Hear AtLast Holdings, Inc. (HRAL) Income Statement Analysis – Financial Results
- Vital KSK Holdings, Inc. (3151.T) Income Statement Analysis – Financial Results
- The Home Depot, Inc. (HDI.DE) Income Statement Analysis – Financial Results
- Weblink International Inc. (6776.TW) Income Statement Analysis – Financial Results
- Aeon Metals Limited (AEOMF) Income Statement Analysis – Financial Results
MasterBrand, Inc. (MBC)
Industry: Furnishings, Fixtures & Appliances
Sector: Consumer Cyclical
Website: https://www.masterbrandcabinets.com
About MasterBrand, Inc.
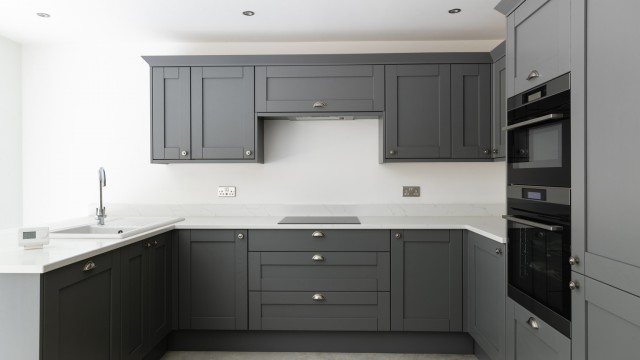
MasterBrand, Inc. manufactures and sells residential cabinets for the kitchen, bathroom, and other parts of the home in North America. The company is based in Jasper, Indiana.
| Metric | 2023 | 2022 | 2021 | 2020 | 2019 |
|---|---|---|---|---|---|
| Revenue | 2.73B | 3.28B | 2.86B | 2.47B | 2.39B |
| Cost of Revenue | 1.85B | 2.34B | 2.07B | 1.77B | 1.70B |
| Gross Profit | 875.90M | 940.50M | 783.90M | 703.00M | 691.80M |
| Gross Profit Ratio | 32.13% | 28.71% | 27.45% | 28.47% | 28.96% |
| Research & Development | 0.00 | 0.00 | 1.60M | 1.40M | 1.50M |
| General & Administrative | 532.80M | 647.20M | 525.60M | 474.20M | 0.00 |
| Selling & Marketing | 37.40M | 1.30M | 2.00M | 0.00 | 0.00 |
| SG&A | 572.60M | 648.50M | 527.60M | 474.20M | 477.80M |
| Other Expenses | 0.00 | 17.20M | 17.80M | 17.80M | 17.80M |
| Operating Expenses | 569.70M | 665.70M | 545.40M | 492.00M | 495.60M |
| Cost & Expenses | 2.42B | 3.00B | 2.62B | 2.26B | 2.19B |
| Interest Income | 0.00 | 12.90M | 4.60M | 2.40M | 100.00K |
| Interest Expense | 65.20M | 2.20M | 0.00 | 0.00 | 0.00 |
| Depreciation & Amortization | 64.30M | 64.50M | 75.10M | 77.50M | 75.00M |
| EBITDA | 368.20M | 356.00M | 313.40M | 273.70M | 210.20M |
| EBITDA Ratio | 13.51% | 10.73% | 10.70% | 11.29% | 12.99% |
| Operating Income | 306.30M | 287.10M | 234.30M | 196.00M | 247.90M |
| Operating Income Ratio | 11.24% | 8.77% | 8.21% | 7.94% | 10.38% |
| Total Other Income/Expenses | -67.60M | 10.10M | 4.00M | 200.00K | -9.30M |
| Income Before Tax | 238.70M | 213.40M | 238.30M | 196.20M | 135.20M |
| Income Before Tax Ratio | 8.76% | 6.52% | 8.35% | 7.95% | 5.66% |
| Income Tax Expense | 56.70M | 58.00M | 55.70M | 50.50M | 34.50M |
| Net Income | 182.00M | 155.40M | 182.60M | 145.70M | 100.70M |
| Net Income Ratio | 6.68% | 4.74% | 6.40% | 5.90% | 4.22% |
| EPS | 1.42 | 1.21 | 1.43 | 1.14 | 0.79 |
| EPS Diluted | 1.40 | 1.20 | 1.43 | 1.14 | 0.79 |
| Weighted Avg Shares Out | 127.80M | 128.00M | 128.02M | 128.02M | 128.02M |
| Weighted Avg Shares Out (Dil) | 129.90M | 129.10M | 128.02M | 128.02M | 128.02M |

Hillman: A Good Moat at a High Price

MasterBrand Is A High-Quality Leader In The Residential Cabinet Industry

First Solar Set to Join S&P 500; Fortune Brands Innovations to Join S&P MidCap 400; MasterBrand to Join S&P SmallCap 600
Source: https://incomestatements.info
Category: Stock Reports
