See more : Tohoku Electric Power Company, Incorporated (TEPCF) Income Statement Analysis – Financial Results
Complete financial analysis of Barings Corporate Investors (MCI) income statement, including revenue, profit margins, EPS and key performance metrics. Get detailed insights into the financial performance of Barings Corporate Investors, a leading company in the Asset Management industry within the Financial Services sector.
- Priority Income Fund, Inc. (PRIF-PL) Income Statement Analysis – Financial Results
- Well Shin Technology Co., Ltd. (3501.TW) Income Statement Analysis – Financial Results
- Evergold Corp. (EVGUF) Income Statement Analysis – Financial Results
- Lvji Technology Holdings Inc. (1745.HK) Income Statement Analysis – Financial Results
- Cornerstone Strategic Value Fund, Inc. (CLM) Income Statement Analysis – Financial Results
Barings Corporate Investors (MCI)
Industry: Asset Management
Sector: Financial Services
Website: https://www.babsoncapital.com/Strategies/Trusts/MCI/Default.aspx
About Barings Corporate Investors
Babson Capital Corporate Investors trust is a closed ended fixed income mutual fund launched and managed by Barings LLC. It invests in fixed income markets of the United States. The fund seeks to invest in securities of companies operating across diversified sectors. It primarily invests in a portfolio of privately placed, below-investment grade, long term corporate debt obligations. The fund also invests in marketable investment grade debt securities, other marketable debt securities, and marketable common stocks. It was formerly known as Babson Capital Corporate Investors. Babson Capital Corporate Investors trust was formed in 1971 and is domiciled in the United States.
| Metric | 2023 | 2022 | 2021 | 2020 | 2019 | 2018 | 2017 | 2016 | 2015 | 2014 | 2013 | 2012 |
|---|---|---|---|---|---|---|---|---|---|---|---|---|
| Revenue | 41.19M | 16.21M | 54.45M | 16.22M | 39.95M | 10.99M | 44.54M | 28.18M | 26.80M | 30.20M | 28.88M | 30.25M |
| Cost of Revenue | 0.00 | 0.00 | 0.00 | 0.00 | 0.00 | 0.00 | 0.00 | 0.00 | 0.00 | 0.00 | 0.00 | 0.00 |
| Gross Profit | 41.19M | 16.21M | 54.45M | 16.22M | 39.95M | 10.99M | 44.54M | 28.18M | 26.80M | 30.20M | 28.88M | 30.25M |
| Gross Profit Ratio | 100.00% | 100.00% | 100.00% | 100.00% | 100.00% | 100.00% | 100.00% | 100.00% | 100.00% | 100.00% | 100.00% | 100.00% |
| Research & Development | 0.00 | 0.00 | 0.00 | 0.00 | 0.00 | 0.00 | 0.00 | 0.00 | 0.00 | 0.00 | 0.00 | 0.00 |
| General & Administrative | 1.34M | 1.18M | 1.05M | 889.01K | 937.22K | 1.40M | 964.49K | 4.43M | 4.79M | 4.63M | 4.43M | 4.16M |
| Selling & Marketing | 0.00 | 0.00 | 0.00 | 0.00 | 0.00 | 0.00 | 0.00 | 0.00 | 0.00 | 0.00 | 0.00 | 0.00 |
| SG&A | 1.34M | 1.18M | 1.05M | 889.01K | 937.22K | 1.40M | 964.49K | 4.43M | 4.79M | 4.63M | 4.43M | 4.16M |
| Other Expenses | 0.00 | 0.00 | 0.00 | 0.00 | 0.00 | 0.00 | 0.00 | 0.00 | 0.00 | 0.00 | 0.00 | 0.00 |
| Operating Expenses | 1.34M | 1.18M | 1.05M | 889.01K | 937.22K | 1.40M | 964.49K | 641.25K | 7.93M | 4.14M | 4.88M | 11.15M |
| Cost & Expenses | 5.62M | 1.18M | 1.05M | 889.01K | 937.22K | 1.40M | 964.49K | 641.25K | 7.93M | 4.14M | 4.88M | 11.15M |
| Interest Income | 40.63M | 28.08M | 24.33M | 28.70M | 27.60M | 29.45M | 27.96M | 1.58M | 1.58M | 1.58M | 1.58M | 1.58M |
| Interest Expense | 2.08M | 1.71M | 1.07M | 1.06M | 1.06M | 1.06M | 1.52M | 0.00 | 0.00 | 0.00 | 0.00 | 0.00 |
| Depreciation & Amortization | -46.47K | -23.32M | -20.54M | -25.45M | -23.64M | -25.27M | -26.77M | -23.76M | -22.01M | -25.57M | -24.45M | -26.09M |
| EBITDA | 0.00 | 0.00 | 67.19M | 0.00 | 0.00 | 0.00 | 0.00 | 0.00 | 0.00 | 0.00 | 0.00 | 13.73M |
| EBITDA Ratio | 0.00% | 103.28% | 98.07% | 94.52% | 97.65% | 96.88% | 101.24% | 12.36% | -17.63% | 23.80% | 26.74% | 45.38% |
| Operating Income | 35.57M | 16.74M | 53.39M | 15.33M | 39.01M | 10.65M | 45.10M | 23.76M | 22.01M | 25.57M | 24.45M | 26.09M |
| Operating Income Ratio | 86.36% | 103.28% | 98.07% | 94.52% | 97.65% | 96.88% | 101.24% | 84.29% | 82.13% | 84.68% | 84.68% | 86.25% |
| Total Other Income/Expenses | 2.09M | -7.91M | 406.60K | -10.11M | 15.37M | -15.68M | 16.81M | 3.48M | -4.72M | 7.19M | 7.72M | 13.73M |
| Income Before Tax | 37.67M | 15.03M | 53.39M | 15.33M | 39.01M | 9.59M | 43.58M | 27.24M | 17.28M | 32.76M | 32.18M | 39.82M |
| Income Before Tax Ratio | 91.45% | 92.72% | 98.07% | 94.52% | 97.65% | 87.24% | 97.83% | 96.65% | 64.49% | 108.48% | 111.41% | 131.63% |
| Income Tax Expense | 706.22K | 766.22K | 585.25K | 15.33M | 39.01M | -161.14K | 26.77M | 3.48M | -4.72M | 7.19M | 7.72M | 2.12M |
| Net Income | 36.96M | 14.26M | 52.81M | 15.33M | 39.01M | 9.59M | 43.58M | 27.24M | 17.28M | 32.76M | 32.18M | 37.70M |
| Net Income Ratio | 89.73% | 88.00% | 96.99% | 94.52% | 97.65% | 87.24% | 97.83% | 96.65% | 64.49% | 108.48% | 111.41% | 124.63% |
| EPS | 1.82 | 0.71 | 2.60 | 0.76 | 1.93 | 0.48 | 2.19 | 1.38 | 0.88 | 1.68 | 1.66 | 1.96 |
| EPS Diluted | 1.82 | 0.71 | 2.60 | 0.76 | 1.93 | 0.48 | 2.19 | 1.38 | 0.88 | 1.68 | 1.66 | 1.96 |
| Weighted Avg Shares Out | 20.26M | 20.09M | 20.26M | 20.18M | 20.21M | 19.97M | 19.90M | 19.79M | 19.66M | 19.53M | 19.39M | 19.24M |
| Weighted Avg Shares Out (Dil) | 20.26M | 20.09M | 20.31M | 20.18M | 20.21M | 19.97M | 19.90M | 19.79M | 19.66M | 19.53M | 19.39M | 19.24M |
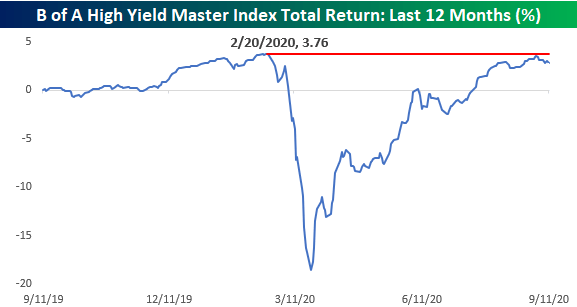
No New Highs For High Yield
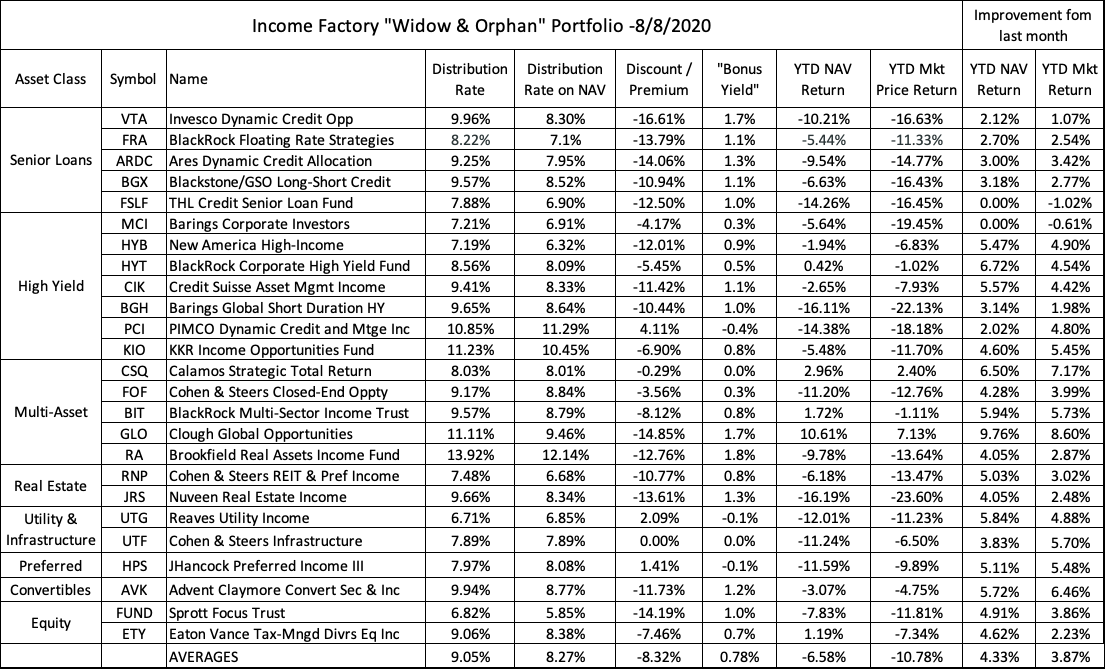
'Widow & Orphan' Income Factory: Update And Portfolio Changes
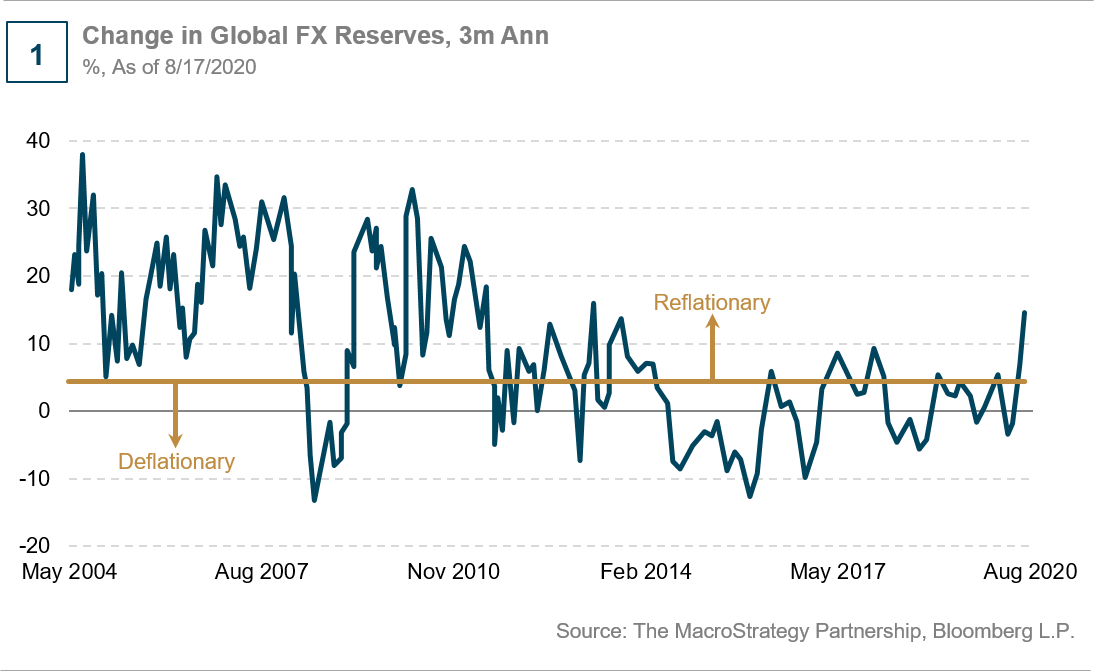
A Cyclical Rotation In Corporate Credit
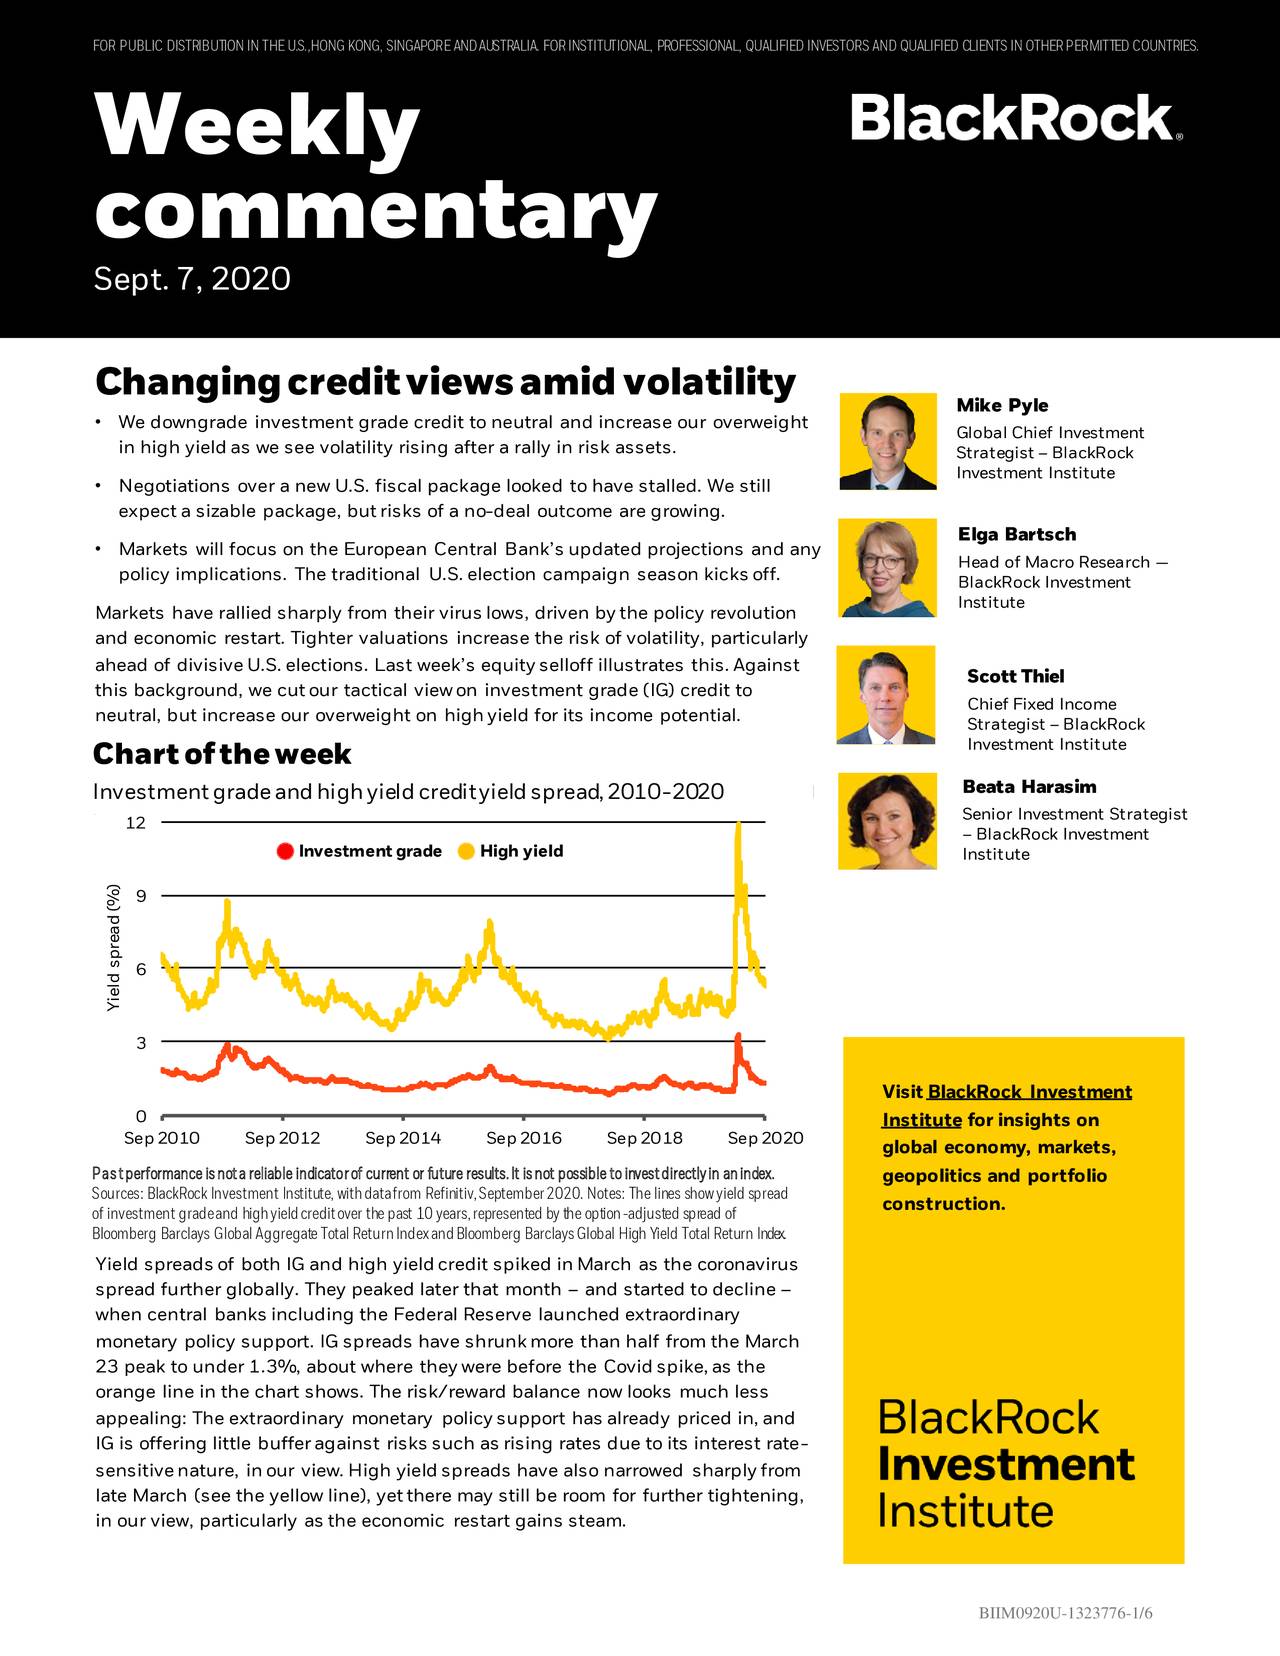
Changing Credit Views Amid Volatility
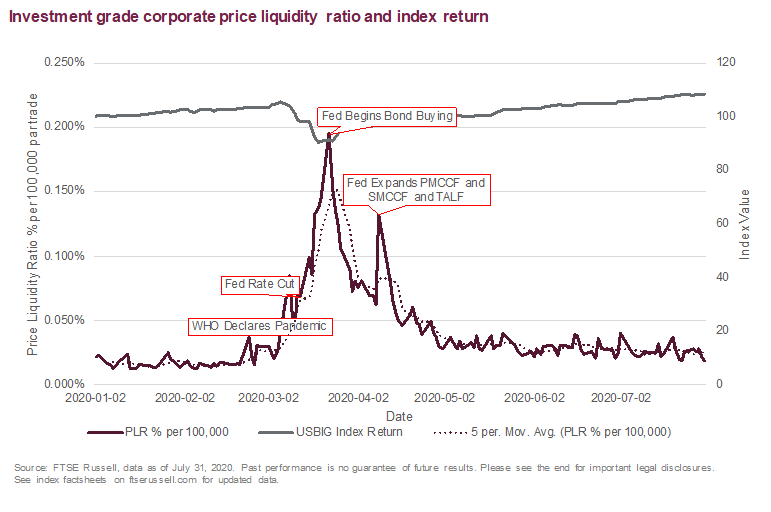
Crisis? What Crisis? USD Corporate Bond Liquidity Since COVID
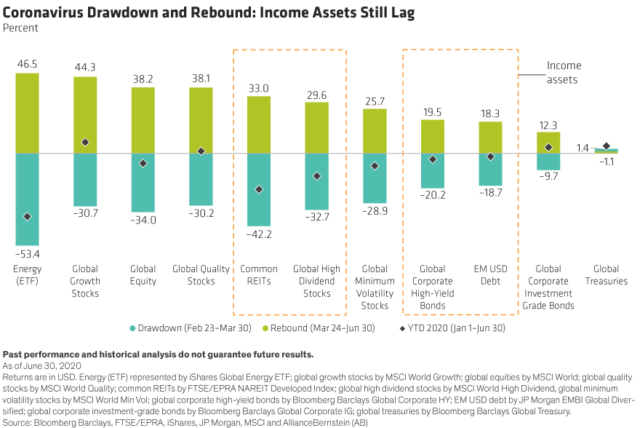
Income Assets Are Down But Not Out
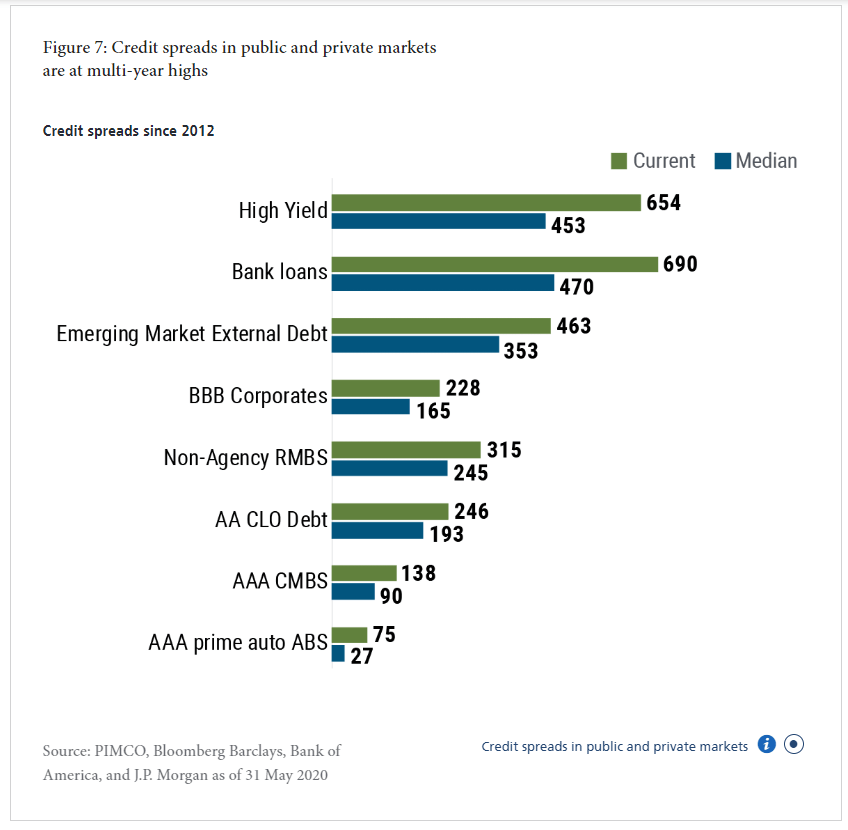
Corporate Credit Markets Remain In Good Shape
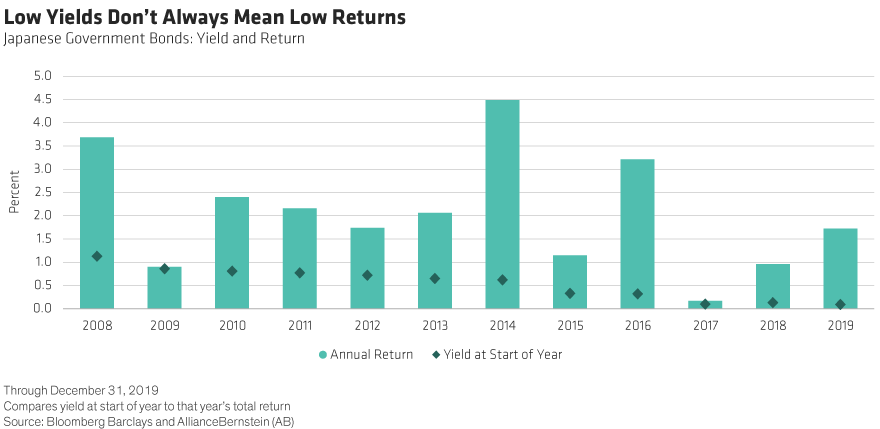
Midyear Outlook: Bond Investing In The Era Of Low And No Yield

Milken Institute Hosts Summer Series Examining Life and Business Amid COVID-19
The One Metric All High-Yield Investors Should Know
Source: https://incomestatements.info
Category: Stock Reports
