Complete financial analysis of Barings Participation Investors (MPV) income statement, including revenue, profit margins, EPS and key performance metrics. Get detailed insights into the financial performance of Barings Participation Investors, a leading company in the Asset Management industry within the Financial Services sector.
- Plurilock Security Inc. (PLCKF) Income Statement Analysis – Financial Results
- Norse Atlantic ASA (NRSAF) Income Statement Analysis – Financial Results
- Extreme Co.,Ltd. (6033.T) Income Statement Analysis – Financial Results
- EnergyPathways plc (EPP.L) Income Statement Analysis – Financial Results
- LEG Immobilien SE (0QC9.L) Income Statement Analysis – Financial Results
Barings Participation Investors (MPV)
About Barings Participation Investors
Barings Participation Investors is a closed ended fixed income mutual fund launched and managed by Barings LLC. The fund invests in the fixed income markets of the United States. It primarily invests in below-investment grade, long-term corporate debt obligations which are directly purchased from its issuers. The fund also seeks to invest in warrants, conversion rights, or other equity related instruments. It benchmarks the performance of its portfolio against Standard and Poor's Industrials Composite, Russell 2000 Index, Lehman Brothers U.S. High Yield Index, and Lehman Brothers Intermediate U.S. Credit Index. The fund was formerly known as Babson Capital Participation Investors. Barings Participation Investors was formed on April 7, 1988 and is domiciled in the United States.
| Metric | 2023 | 2022 | 2021 | 2020 | 2019 | 2018 | 2017 | 2016 | 2015 | 2014 | 2013 | 2012 | 2010 |
|---|---|---|---|---|---|---|---|---|---|---|---|---|---|
| Revenue | 20.12M | 8.26M | 26.45M | 7.04M | 18.59M | 4.61M | 19.96M | 12.81M | 12.47M | 13.32M | 12.83M | 13.45M | 0.00 |
| Cost of Revenue | 2.17M | 1.87M | 1.84M | 1.64M | 1.69M | 1.68M | 1.66M | 0.00 | 0.00 | 0.00 | 0.00 | 0.00 | 0.00 |
| Gross Profit | 17.95M | 6.39M | 24.60M | 5.40M | 16.90M | 2.93M | 18.30M | 12.81M | 12.47M | 13.32M | 12.83M | 13.45M | 0.00 |
| Gross Profit Ratio | 89.22% | 77.31% | 93.03% | 76.71% | 90.90% | 63.61% | 91.70% | 100.00% | 100.00% | 100.00% | 100.00% | 100.00% | 0.00% |
| Research & Development | 0.00 | 0.55 | 1.48 | 0.45 | 1.26 | 0.23 | 1.17 | 0.00 | 0.00 | 0.00 | 0.00 | 0.00 | 0.00 |
| General & Administrative | 2.55M | 924.15K | 816.76K | 692.25K | 780.77K | 965.61K | 823.76K | 1.88M | 2.09M | 2.04M | 1.99M | 1.87M | 0.00 |
| Selling & Marketing | 0.00 | 0.00 | 0.00 | 0.00 | 0.00 | 0.00 | 0.00 | 0.00 | 0.00 | 0.00 | 0.00 | 0.00 | 0.00 |
| SG&A | 2.55M | 924.15K | 816.76K | 692.25K | 780.77K | 965.61K | 823.76K | 1.88M | 2.09M | 2.04M | 1.99M | 1.87M | 0.00 |
| Other Expenses | 0.00 | -3.23M | 11.16M | -4.84M | 6.06M | -613.49K | -613.50K | 0.00 | 0.00 | 0.00 | 0.00 | 0.00 | 0.00 |
| Operating Expenses | 2.55M | 924.15K | 816.76K | 692.25K | 780.77K | 965.61K | 823.76K | 557.63K | 3.30M | 3.79M | 1.55M | 4.67M | 0.00 |
| Cost & Expenses | 2.55M | 924.15K | 816.76K | 692.25K | 780.77K | 965.61K | 823.76K | 557.63K | 3.30M | 3.79M | 1.55M | 4.67M | 0.00 |
| Interest Income | 19.84M | 13.78M | 11.62M | 12.79M | 12.93M | 13.20M | 12.46M | 613.50K | 613.50K | 613.50K | 613.50K | 613.50K | 0.00 |
| Interest Expense | 1.25M | 1.01M | 622.86K | 613.50K | 613.50K | 613.50K | 613.50K | 0.00 | 0.00 | 0.00 | 0.00 | 0.00 | 0.00 |
| Depreciation & Amortization | -25.77K | 5.11M | -9.31M | 6.48M | -3.76M | 13.47M | -3.13M | -10.94M | -10.38M | -11.28M | -10.84M | -11.58M | 0.00 |
| EBITDA | 19.82M | 8.55M | 0.00 | 6.35M | 0.00 | 4.25M | 0.00 | 0.00 | 0.00 | 0.00 | 0.00 | 5.93M | 0.00 |
| EBITDA Ratio | 98.53% | 101.07% | 96.91% | 90.17% | 95.80% | 92.35% | 98.95% | 5.50% | -14.60% | 39.17% | 22.77% | 44.11% | 0.00% |
| Operating Income | 17.56M | 8.35M | 25.63M | 6.35M | 17.81M | 4.25M | 19.75M | 10.94M | 10.38M | 11.28M | 10.84M | 11.58M | 0.00 |
| Operating Income Ratio | 87.32% | 101.07% | 96.91% | 90.17% | 95.80% | 92.35% | 98.95% | 85.36% | 83.21% | 84.69% | 84.50% | 86.07% | 0.00% |
| Total Other Income/Expenses | 996.70K | 1.87M | 0.00 | 1.64M | 0.00 | -613.50K | 7.18M | 704.89K | -1.82M | 5.22M | 2.92M | 5.93M | 0.00 |
| Income Before Tax | 18.56M | 7.34M | 25.63M | 6.35M | 17.81M | 3.64M | 19.14M | 11.64M | 8.56M | 16.50M | 13.76M | 17.51M | 0.00 |
| Income Before Tax Ratio | 92.27% | 88.82% | 96.91% | 90.17% | 95.80% | 79.03% | 95.87% | 90.86% | 68.61% | 123.87% | 107.27% | 130.18% | 0.00% |
| Income Tax Expense | 441.37K | 377.85K | 247.15K | -474.93K | 566.90K | -161.14K | 21.99M | 704.89K | -1.82M | 5.22M | 2.92M | 5.93M | 0.00 |
| Net Income | 18.12M | 6.96M | 25.38M | 6.35M | 17.81M | 3.64M | 19.14M | 11.64M | 8.56M | 16.50M | 13.76M | 17.51M | 0.00 |
| Net Income Ratio | 90.08% | 84.24% | 95.98% | 90.17% | 95.80% | 79.03% | 95.87% | 90.86% | 68.61% | 123.87% | 107.27% | 130.18% | 0.00% |
| EPS | 1.71 | 0.66 | 2.39 | 0.60 | 1.69 | 0.35 | 1.84 | 1.12 | 0.83 | 1.60 | 1.34 | 1.72 | 0.00 |
| EPS Diluted | 1.71 | 0.66 | 2.39 | 0.60 | 1.69 | 0.35 | 1.84 | 1.12 | 0.83 | 1.60 | 1.34 | 1.72 | 0.00 |
| Weighted Avg Shares Out | 10.60M | 10.60M | 10.60M | 10.60M | 10.54M | 10.40M | 10.40M | 10.39M | 10.33M | 10.30M | 10.24M | 10.18M | 10.05M |
| Weighted Avg Shares Out (Dil) | 10.60M | 10.60M | 10.60M | 10.60M | 10.54M | 10.40M | 10.40M | 10.39M | 10.33M | 10.30M | 10.24M | 10.18M | 10.05M |
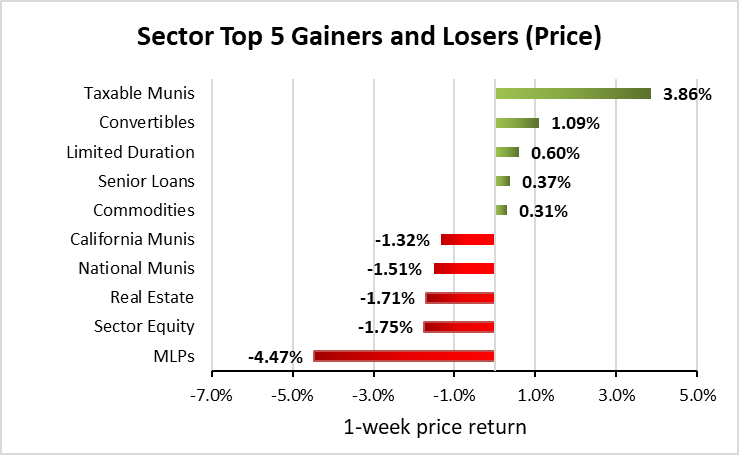
Weekly Closed-End Fund Roundup: August 23, 2020
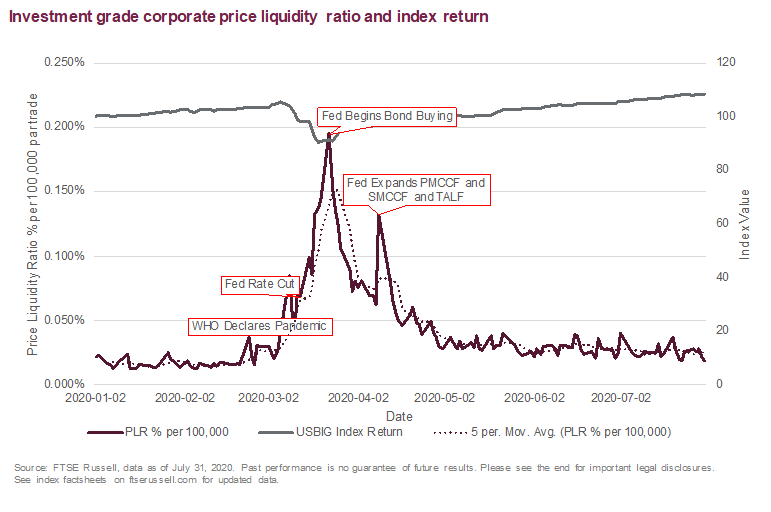
Crisis? What Crisis? USD Corporate Bond Liquidity Since COVID

5 Best CEFs To Buy This Month (August 2020)
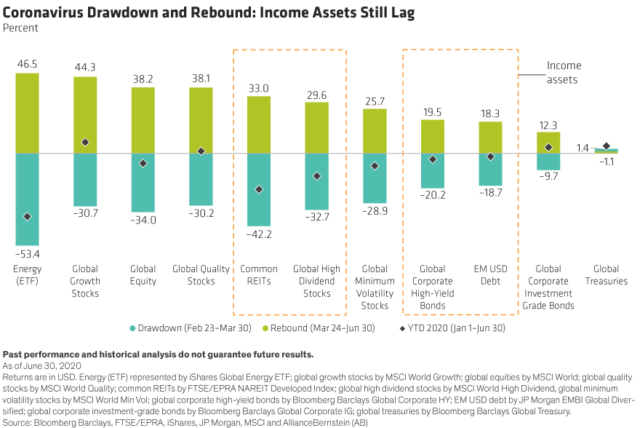
Income Assets Are Down But Not Out

5 Best CEFs To Buy This Month (July 2020)
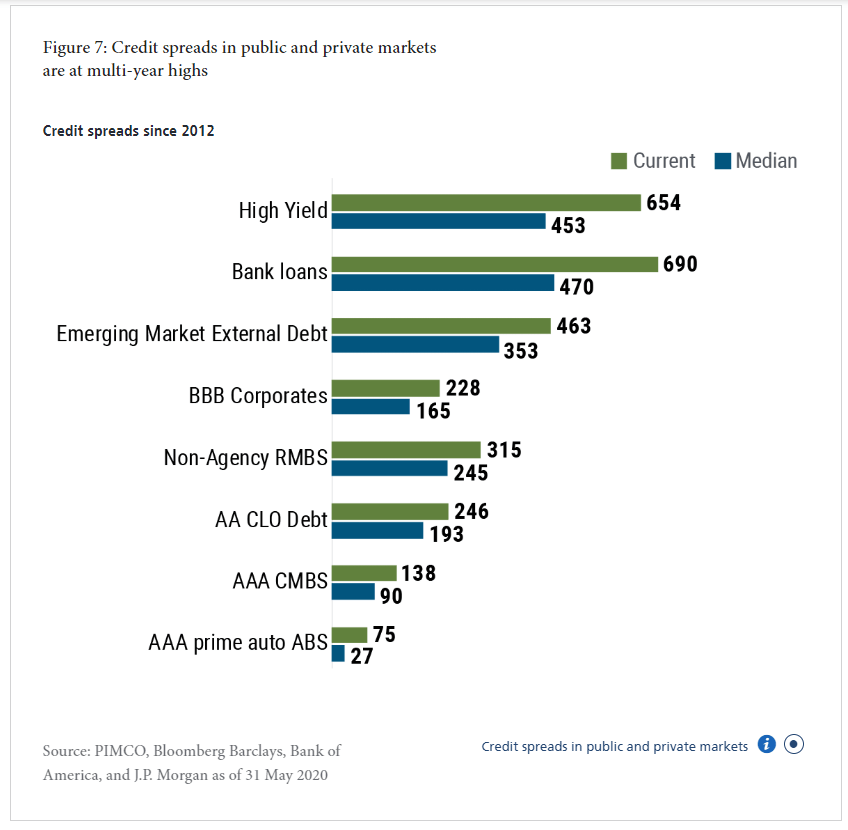
Corporate Credit Markets Remain In Good Shape
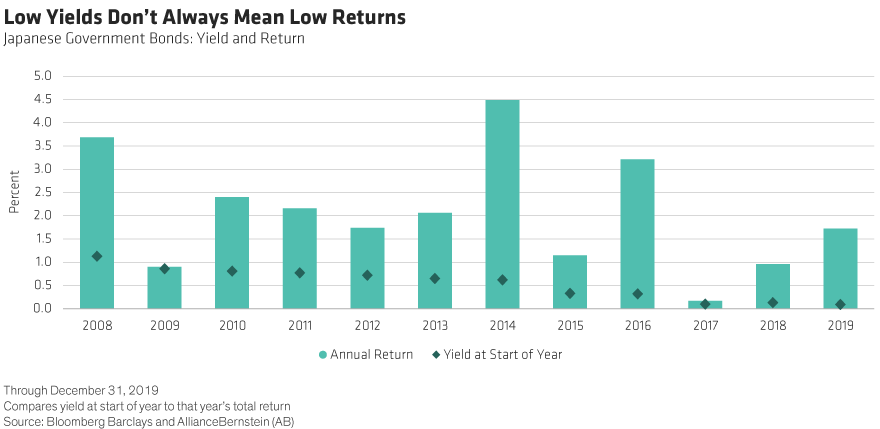
Midyear Outlook: Bond Investing In The Era Of Low And No Yield

Milken Institute Hosts Summer Series Examining Life and Business Amid COVID-19
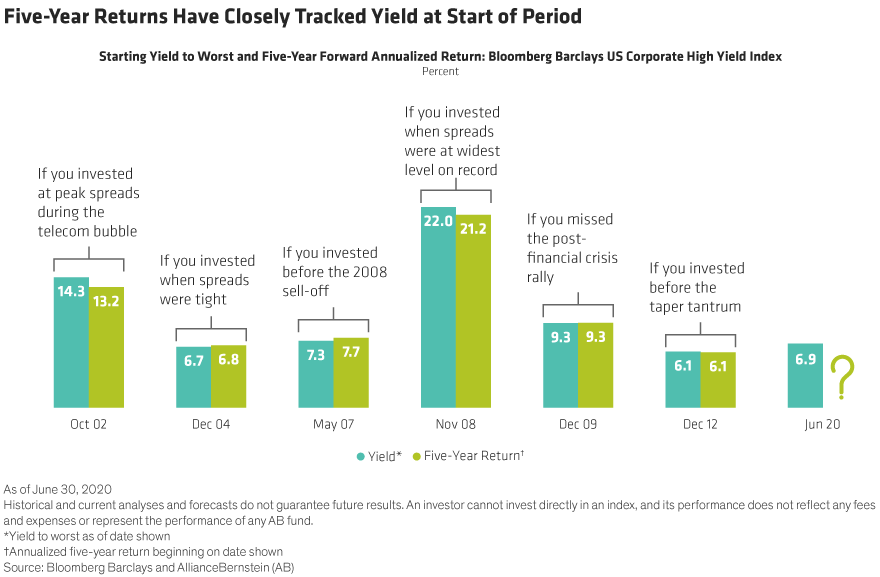
The One Metric All High-Yield Investors Should Know

Squarepoint Ops LLC Sells 12,946 Shares of Arcosa Inc (NYSE:ACA)
Source: https://incomestatements.info
Category: Stock Reports
