See more : Neuland Laboratories Limited (NEULANDLAB.NS) Income Statement Analysis – Financial Results
Complete financial analysis of Emerson Radio Corp. (MSN) income statement, including revenue, profit margins, EPS and key performance metrics. Get detailed insights into the financial performance of Emerson Radio Corp., a leading company in the Consumer Electronics industry within the Technology sector.
- Value Added Technology Co., Ltd. (043150.KQ) Income Statement Analysis – Financial Results
- Grupo Aeroportuario del Pacífico, S.A.B. de C.V. (PAC) Income Statement Analysis – Financial Results
- Charah Solutions, Inc. 8.50% Se (CHRB) Income Statement Analysis – Financial Results
- J.A. Finance Limited (JAFINANCE.BO) Income Statement Analysis – Financial Results
- Shenzhen Sunway Communication Co., Ltd. (300136.SZ) Income Statement Analysis – Financial Results
Emerson Radio Corp. (MSN)
About Emerson Radio Corp.
Emerson Radio Corp., together with its subsidiaries, designs, sources, imports, markets, and sells various houseware and consumer electronic products under the Emerson brand in the United States and internationally. It offers houseware products, such as microwave ovens, compact refrigerators, wine products, and toaster ovens; audio products, including clock radios, Bluetooth speakers, and wireless charging products; and other products comprising massagers, toothbrushes, and security products. The company also licenses its trademarks to others on a worldwide basis for various products. Emerson Radio Corp. markets its products primarily through mass merchandisers and online marketplaces. The company was founded in 1912 and is headquartered in Parsippany, New Jersey.
| Metric | 2024 | 2023 | 2022 | 2021 | 2020 | 2019 | 2018 | 2017 | 2016 | 2015 | 2014 | 2013 | 2012 | 2011 | 2010 | 2009 | 2008 | 2007 | 2006 | 2005 | 2004 | 2003 | 2002 | 2001 | 2000 | 1999 | 1998 | 1997 | 1996 | 1995 | 1994 | 1993 |
|---|---|---|---|---|---|---|---|---|---|---|---|---|---|---|---|---|---|---|---|---|---|---|---|---|---|---|---|---|---|---|---|---|
| Revenue | 9.07M | 7.18M | 8.21M | 7.45M | 6.29M | 8.98M | 15.02M | 21.25M | 45.75M | 76.32M | 77.83M | 128.40M | 163.25M | 200.84M | 206.96M | 200.60M | 223.23M | 284.40M | 233.84M | 320.70M | 263.77M | 347.78M | 318.45M | 377.41M | 204.96M | 158.70M | 162.70M | 178.70M | 245.70M | 654.70M | 487.40M | 741.40M |
| Cost of Revenue | 7.51M | 5.08M | 6.24M | 5.75M | 6.76M | 8.76M | 13.92M | 16.28M | 38.82M | 62.09M | 63.01M | 108.63M | 142.27M | 172.92M | 175.46M | 182.35M | 201.05M | 248.07M | 204.01M | 268.17M | 220.71M | 275.24M | 258.68M | 310.42M | 181.32M | 141.30M | 145.00M | 174.40M | 232.60M | 609.20M | 491.20M | 687.40M |
| Gross Profit | 1.56M | 2.10M | 1.97M | 1.70M | -462.00K | 222.00K | 1.10M | 4.97M | 6.93M | 14.24M | 14.82M | 19.77M | 20.98M | 27.92M | 31.50M | 18.25M | 22.18M | 36.33M | 29.83M | 52.53M | 43.07M | 72.55M | 59.77M | 66.99M | 23.64M | 17.40M | 17.70M | 4.30M | 13.10M | 45.50M | -3.80M | 54.00M |
| Gross Profit Ratio | 17.24% | 29.27% | 23.99% | 22.78% | -7.34% | 2.47% | 7.33% | 23.41% | 15.15% | 18.65% | 19.04% | 15.39% | 12.85% | 13.90% | 15.22% | 9.10% | 9.94% | 12.78% | 12.76% | 16.38% | 16.33% | 20.86% | 18.77% | 17.75% | 11.53% | 10.96% | 10.88% | 2.41% | 5.33% | 6.95% | -0.78% | 7.28% |
| Research & Development | 0.00 | 0.00 | 0.00 | 0.00 | 0.00 | 0.00 | 0.00 | 0.00 | 0.00 | 0.00 | 0.00 | 0.00 | 0.00 | 0.00 | 0.00 | 0.00 | 0.00 | 0.00 | 0.00 | 0.00 | 0.00 | 0.00 | 0.00 | 0.00 | 0.00 | 0.00 | 0.00 | 0.00 | 0.00 | 0.00 | 0.00 | 0.00 |
| General & Administrative | 4.84M | 4.16M | 5.37M | 5.87M | 4.00M | 3.72M | 4.91M | 0.00 | 7.95M | 0.00 | 0.00 | 0.00 | 0.00 | 0.00 | 0.00 | 0.00 | 0.00 | 0.00 | 0.00 | 0.00 | 0.00 | 0.00 | 0.00 | 0.00 | 0.00 | 0.00 | 0.00 | 0.00 | 0.00 | 0.00 | 0.00 | 0.00 |
| Selling & Marketing | 122.00K | 39.00K | 42.00K | 23.00K | 165.00K | 121.00K | 17.00K | 0.00 | 19.00K | 0.00 | 0.00 | 0.00 | 0.00 | 0.00 | 0.00 | 0.00 | 0.00 | 0.00 | 0.00 | 0.00 | 0.00 | 0.00 | 0.00 | 0.00 | 0.00 | 0.00 | 0.00 | 0.00 | 0.00 | 0.00 | 0.00 | 0.00 |
| SG&A | 4.96M | 4.20M | 5.41M | 5.89M | 4.16M | 3.84M | 4.92M | 5.10M | 7.97M | 8.83M | 10.43M | 7.76M | 7.76M | 7.38M | 14.60M | 16.89M | 29.51M | 28.95M | 25.62M | 41.68M | 42.55M | 53.01M | 49.46M | 53.50M | 17.00M | 12.90M | 15.50M | 18.80M | 19.50M | 31.00M | 34.60M | 49.50M |
| Other Expenses | 0.00 | -34.00K | -207.00K | -83.00K | 0.00 | 27.00K | 60.00K | 199.00K | 367.00K | 661.00K | 864.00K | 1.36M | 1.35M | 1.64M | 3.13M | 5.76M | 0.00 | -64.80M | 0.00 | 0.00 | 0.00 | 0.00 | 0.00 | 0.00 | 1.31M | 1.20M | 1.80M | 2.90M | 3.70M | 3.90M | 7.30M | 6.40M |
| Operating Expenses | 4.96M | 4.16M | 5.20M | 5.81M | 4.16M | 3.87M | 4.98M | 5.30M | 8.34M | 9.49M | 11.30M | 9.11M | 9.12M | 9.02M | 17.73M | 22.65M | 29.51M | -35.85M | 25.62M | 41.68M | 42.55M | 53.01M | 49.46M | 53.50M | 18.30M | 14.10M | 17.30M | 21.70M | 23.20M | 34.90M | 41.90M | 55.90M |
| Cost & Expenses | 12.47M | 9.24M | 11.44M | 11.56M | 10.92M | 12.63M | 18.90M | 21.58M | 47.16M | 71.58M | 74.31M | 117.75M | 151.39M | 181.94M | 193.20M | 205.00M | 230.55M | 212.22M | 229.63M | 309.86M | 263.25M | 328.25M | 308.14M | 363.92M | 199.62M | 155.40M | 162.30M | 196.10M | 255.80M | 644.10M | 533.10M | 743.30M |
| Interest Income | 1.16M | 712.00K | 68.00K | 158.00K | 776.00K | 859.00K | 496.00K | 261.00K | 178.00K | 215.00K | 548.00K | 355.00K | 70.00K | 192.00K | 289.00K | 502.00K | 826.00K | 0.00 | 0.00 | 0.00 | 0.00 | 0.00 | 0.00 | 0.00 | 0.00 | 0.00 | 0.00 | 0.00 | 0.00 | 0.00 | 0.00 | 0.00 |
| Interest Expense | 5.00K | 10.00K | 11.00K | 7.00K | 0.00 | 859.00K | 4.00K | 261.00K | 178.00K | 215.00K | 6.00K | 15.00K | 23.00K | 160.00K | 313.00K | 257.00K | 523.00K | 0.00 | 0.00 | 0.00 | 0.00 | 0.00 | 0.00 | 0.00 | 0.00 | 0.00 | 0.00 | 0.00 | 0.00 | 0.00 | 0.00 | 0.00 |
| Depreciation & Amortization | 26.00K | 205.00K | 214.00K | 233.00K | 35.00K | 5.00K | 8.00K | 16.00K | 48.00K | 75.00K | 88.00K | 106.00K | 276.00K | 502.00K | 846.00K | 775.00K | 823.00K | 850.00K | 1.08M | 3.28M | 3.38M | 3.14M | 3.60M | 2.73M | 1.31M | 1.20M | 1.80M | 2.90M | 3.70M | 3.90M | 7.30M | 6.40M |
| EBITDA | 887.00K | -1.15M | -3.40M | -3.74M | -3.82M | -2.78M | -3.38M | -49.00K | -1.18M | 5.04M | -58.00K | 9.79M | 13.41M | 22.37M | 14.90M | -3.24M | -6.31M | 9.07M | 5.74M | 10.35M | 5.29M | 22.68M | 13.92M | 16.22M | 6.65M | 5.00M | 2.20M | -14.50M | -6.40M | 14.50M | -38.40M | 4.50M |
| EBITDA Ratio | 9.78% | -15.95% | -35.96% | -49.98% | -60.62% | -31.00% | -22.49% | -0.23% | -2.58% | 6.22% | 9.94% | 8.65% | 6.55% | 9.76% | 7.20% | -1.56% | -2.63% | 25.75% | 2.28% | 4.27% | 2.07% | 6.52% | 3.45% | 4.30% | 3.24% | 3.15% | 0.86% | -6.44% | -2.60% | 2.21% | -4.31% | 5.33% |
| Operating Income | -3.40M | -2.06M | -3.23M | -4.11M | -4.63M | -3.65M | -3.88M | -326.00K | -1.41M | 4.75M | 3.30M | 9.33M | 11.87M | 18.91M | 13.77M | -4.40M | -7.32M | 71.99M | 4.17M | 11.30M | -1.03M | 19.54M | 10.31M | 13.49M | 5.33M | 3.30M | 400.00K | -17.40M | -10.10M | 10.60M | -45.70M | -1.90M |
| Operating Income Ratio | -37.48% | -28.73% | -39.40% | -55.23% | -73.51% | -40.61% | -25.84% | -1.53% | -3.07% | 6.22% | 4.24% | 7.26% | 7.27% | 9.41% | 6.65% | -2.19% | -3.28% | 25.31% | 1.78% | 3.52% | -0.39% | 5.62% | 3.24% | 3.58% | 2.60% | 2.08% | 0.25% | -9.74% | -4.11% | 1.62% | -9.38% | -0.26% |
| Total Other Income/Expenses | 4.26M | 736.00K | -186.00K | 234.00K | 776.00K | 859.00K | 492.00K | 261.00K | 178.00K | 215.00K | -3.45M | 340.00K | 1.25M | 2.80M | -24.00K | 128.00K | -447.00K | -894.00K | -785.00K | -3.21M | -883.00K | -1.78M | 1.43M | -1.78M | -2.29M | -2.78M | -1.50M | -6.40M | 0.00 | -2.90M | -27.70M | -53.40M |
| Income Before Tax | 856.00K | -1.36M | -3.63M | -3.96M | -3.85M | -2.79M | -3.39M | -65.00K | -1.23M | 4.96M | -152.00K | 9.67M | 13.11M | 21.71M | 13.74M | -4.27M | -7.65M | 7.14M | 3.38M | 8.84M | -1.59M | 17.76M | 11.75M | 11.71M | 3.04M | 500.00K | -1.10M | -23.80M | 0.00 | 7.70M | -73.40M | -55.30M |
| Income Before Tax Ratio | 9.44% | -18.95% | -44.19% | -53.20% | -61.18% | -31.05% | -22.57% | -0.31% | -2.68% | 6.50% | -0.20% | 7.53% | 8.03% | 10.81% | 6.64% | -2.13% | -3.43% | 2.51% | 1.45% | 2.76% | -0.60% | 5.11% | 3.69% | 3.10% | 1.48% | 0.32% | -0.68% | -13.32% | 0.00% | 1.18% | -15.06% | -7.46% |
| Income Tax Expense | 90.00K | -702.00K | 11.00K | 15.00K | 457.00K | -352.00K | 3.46M | 172.00K | -259.00K | 3.07M | -1.47M | 3.67M | 2.48M | 5.79M | 2.37M | -90.00K | 1.43M | 3.68M | -328.00K | 2.98M | 2.15M | -9.29M | -7.66M | -944.00K | -577.00K | 200.00K | 300.00K | 200.00K | 3.30M | 300.00K | 300.00K | 700.00K |
| Net Income | 766.00K | -658.00K | -3.64M | -3.98M | -4.31M | -2.44M | -6.85M | -237.00K | -968.00K | 1.89M | 1.32M | 6.00M | 10.63M | 15.92M | 11.32M | -4.82M | -9.02M | 3.46M | 16.63M | 5.91M | -1.07M | 21.50M | 19.41M | 12.65M | 3.62M | 300.00K | -1.40M | -24.00M | -13.40M | 7.40M | 55.50M | -56.00M |
| Net Income Ratio | 8.45% | -9.17% | -44.32% | -53.40% | -68.44% | -27.13% | -45.61% | -1.12% | -2.12% | 2.48% | 1.69% | 4.67% | 6.51% | 7.93% | 5.47% | -2.40% | -4.04% | 1.22% | 7.11% | 1.84% | -0.41% | 6.18% | 6.09% | 3.35% | 1.77% | 0.19% | -0.86% | -13.43% | -5.45% | 1.13% | 11.39% | -7.55% |
| EPS | 0.04 | -0.03 | -0.17 | -0.19 | -0.20 | -0.11 | -0.27 | -0.01 | -0.04 | 0.07 | 0.05 | 0.22 | 0.39 | 0.59 | 0.42 | -0.18 | -0.33 | 0.13 | 0.61 | 0.22 | -0.04 | 0.78 | 0.62 | 0.36 | 0.07 | -0.01 | -0.03 | -0.60 | -0.35 | 0.25 | 1.43 | -1.47 |
| EPS Diluted | 0.04 | -0.03 | -0.17 | -0.19 | -0.20 | -0.11 | -0.27 | -0.01 | -0.04 | 0.07 | 0.05 | 0.22 | 0.39 | 0.59 | 0.42 | -0.18 | -0.33 | 0.13 | 0.61 | 0.22 | -0.04 | 0.75 | 0.52 | 0.33 | 0.07 | -0.01 | -0.03 | -0.60 | -0.35 | 0.16 | 1.43 | -1.47 |
| Weighted Avg Shares Out | 21.04M | 21.04M | 21.04M | 21.04M | 21.04M | 21.93M | 25.28M | 27.12M | 27.13M | 27.13M | 27.13M | 27.13M | 27.13M | 27.13M | 27.13M | 27.13M | 27.13M | 27.09M | 27.08M | 26.99M | 27.23M | 27.72M | 31.30M | 35.07M | 47.63M | 49.99M | 45.17M | 40.29M | 38.29M | 29.60M | 38.81M | 38.10M |
| Weighted Avg Shares Out (Dil) | 21.04M | 21.04M | 21.04M | 21.04M | 21.04M | 21.93M | 25.28M | 27.12M | 27.13M | 27.13M | 27.13M | 27.13M | 27.13M | 27.13M | 27.13M | 27.13M | 27.13M | 27.13M | 27.17M | 27.26M | 27.23M | 28.64M | 40.49M | 38.57M | 53.51M | 49.99M | 45.17M | 40.29M | 38.29M | 46.25M | 38.81M | 38.10M |

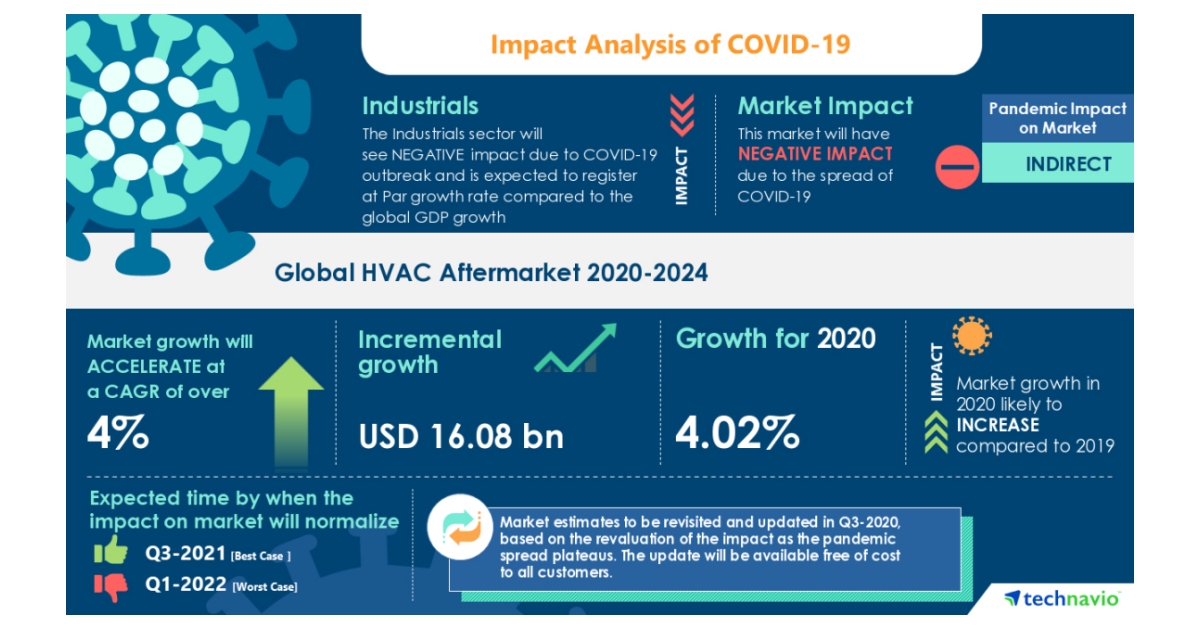
HVAC Aftermarket- Roadmap for Recovery from COVID-19 | Growing Industrialization in Emerging Economies to Boost Market Growth | Technavio

New York restaurants face make-or-break moment as indoor dining arrives

5 Dividend Aristocrats To Buy And 5 Dividend Aristocrats To Avoid

Opinion | On Being Black and Conservative

Scott Darling Sells 5,333 Shares of Stitch Fix Inc (NASDAQ:SFIX) Stock

Strong New Product And New Market Development Have Driven Techtronic (OTCMKTS:TTNDY)

XLU: On A Bumpy Ride (NYSEARCA:XLU)

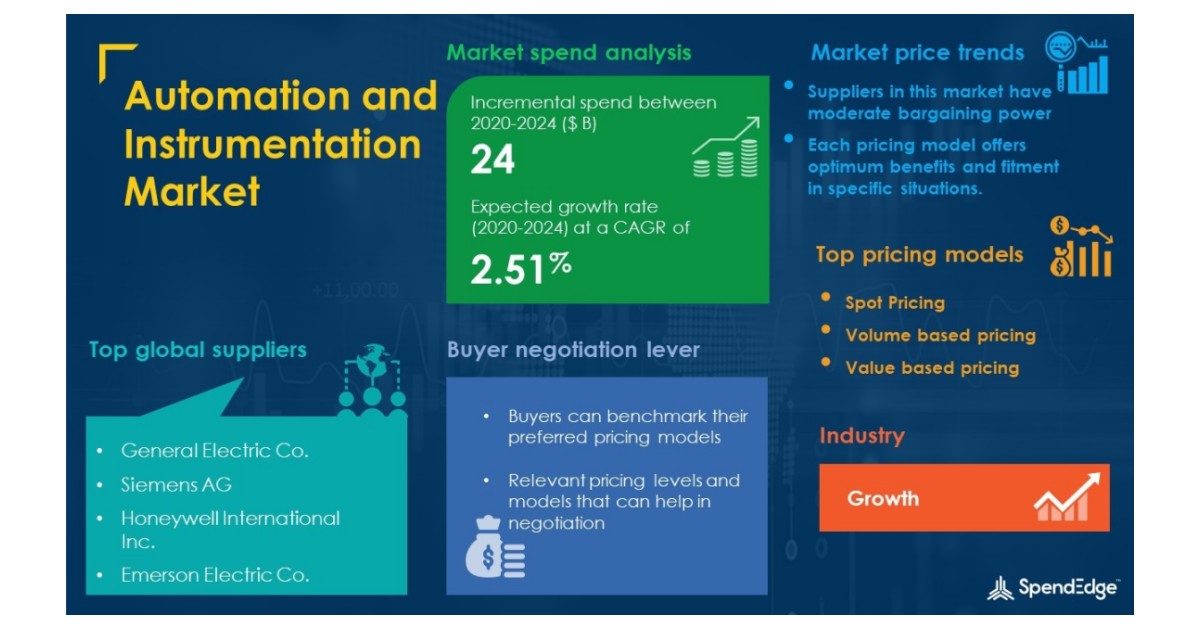
Automation and Instrumentation Market Procurement Intelligence Report With COVID-19 Impact Analysis | Global Forecasts, 2020-2024 | SpendEdge

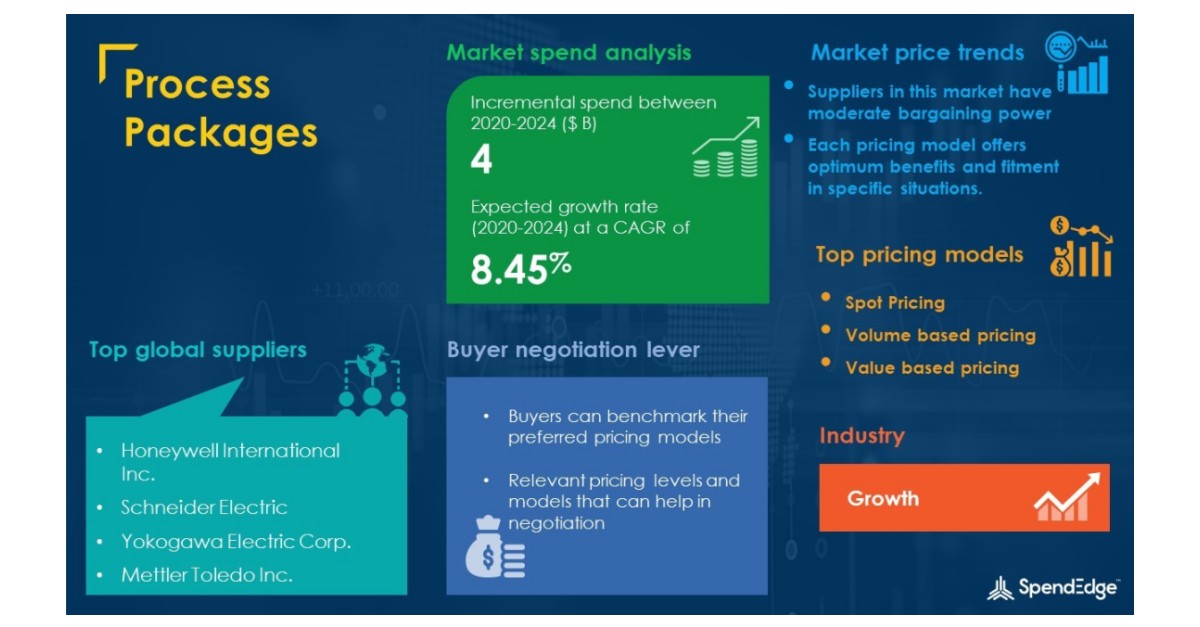
Process Packages Market Procurement Intelligence Report with COVID-19 Impact Analysis | Global Forecasts, 2020-2024
Source: https://incomestatements.info
Category: Stock Reports

