See more : Janus Henderson Group plc (0RPW.L) Income Statement Analysis – Financial Results
Complete financial analysis of Emerson Radio Corp. (MSN) income statement, including revenue, profit margins, EPS and key performance metrics. Get detailed insights into the financial performance of Emerson Radio Corp., a leading company in the Consumer Electronics industry within the Technology sector.
- MGM China Holdings Limited (MCHVY) Income Statement Analysis – Financial Results
- Zioncom Holdings Limited (8287.HK) Income Statement Analysis – Financial Results
- Quaser Machine Tools, Inc. (4563.TWO) Income Statement Analysis – Financial Results
- Getaround, Inc. (GETR) Income Statement Analysis – Financial Results
- Pricer AB (publ) (PCRBF) Income Statement Analysis – Financial Results
Emerson Radio Corp. (MSN)
About Emerson Radio Corp.
Emerson Radio Corp., together with its subsidiaries, designs, sources, imports, markets, and sells various houseware and consumer electronic products under the Emerson brand in the United States and internationally. It offers houseware products, such as microwave ovens, compact refrigerators, wine products, and toaster ovens; audio products, including clock radios, Bluetooth speakers, and wireless charging products; and other products comprising massagers, toothbrushes, and security products. The company also licenses its trademarks to others on a worldwide basis for various products. Emerson Radio Corp. markets its products primarily through mass merchandisers and online marketplaces. The company was founded in 1912 and is headquartered in Parsippany, New Jersey.
| Metric | 2024 | 2023 | 2022 | 2021 | 2020 | 2019 | 2018 | 2017 | 2016 | 2015 | 2014 | 2013 | 2012 | 2011 | 2010 | 2009 | 2008 | 2007 | 2006 | 2005 | 2004 | 2003 | 2002 | 2001 | 2000 | 1999 | 1998 | 1997 | 1996 | 1995 | 1994 | 1993 |
|---|---|---|---|---|---|---|---|---|---|---|---|---|---|---|---|---|---|---|---|---|---|---|---|---|---|---|---|---|---|---|---|---|
| Revenue | 9.07M | 7.18M | 8.21M | 7.45M | 6.29M | 8.98M | 15.02M | 21.25M | 45.75M | 76.32M | 77.83M | 128.40M | 163.25M | 200.84M | 206.96M | 200.60M | 223.23M | 284.40M | 233.84M | 320.70M | 263.77M | 347.78M | 318.45M | 377.41M | 204.96M | 158.70M | 162.70M | 178.70M | 245.70M | 654.70M | 487.40M | 741.40M |
| Cost of Revenue | 7.51M | 5.08M | 6.24M | 5.75M | 6.76M | 8.76M | 13.92M | 16.28M | 38.82M | 62.09M | 63.01M | 108.63M | 142.27M | 172.92M | 175.46M | 182.35M | 201.05M | 248.07M | 204.01M | 268.17M | 220.71M | 275.24M | 258.68M | 310.42M | 181.32M | 141.30M | 145.00M | 174.40M | 232.60M | 609.20M | 491.20M | 687.40M |
| Gross Profit | 1.56M | 2.10M | 1.97M | 1.70M | -462.00K | 222.00K | 1.10M | 4.97M | 6.93M | 14.24M | 14.82M | 19.77M | 20.98M | 27.92M | 31.50M | 18.25M | 22.18M | 36.33M | 29.83M | 52.53M | 43.07M | 72.55M | 59.77M | 66.99M | 23.64M | 17.40M | 17.70M | 4.30M | 13.10M | 45.50M | -3.80M | 54.00M |
| Gross Profit Ratio | 17.24% | 29.27% | 23.99% | 22.78% | -7.34% | 2.47% | 7.33% | 23.41% | 15.15% | 18.65% | 19.04% | 15.39% | 12.85% | 13.90% | 15.22% | 9.10% | 9.94% | 12.78% | 12.76% | 16.38% | 16.33% | 20.86% | 18.77% | 17.75% | 11.53% | 10.96% | 10.88% | 2.41% | 5.33% | 6.95% | -0.78% | 7.28% |
| Research & Development | 0.00 | 0.00 | 0.00 | 0.00 | 0.00 | 0.00 | 0.00 | 0.00 | 0.00 | 0.00 | 0.00 | 0.00 | 0.00 | 0.00 | 0.00 | 0.00 | 0.00 | 0.00 | 0.00 | 0.00 | 0.00 | 0.00 | 0.00 | 0.00 | 0.00 | 0.00 | 0.00 | 0.00 | 0.00 | 0.00 | 0.00 | 0.00 |
| General & Administrative | 4.84M | 4.16M | 5.37M | 5.87M | 4.00M | 3.72M | 4.91M | 0.00 | 7.95M | 0.00 | 0.00 | 0.00 | 0.00 | 0.00 | 0.00 | 0.00 | 0.00 | 0.00 | 0.00 | 0.00 | 0.00 | 0.00 | 0.00 | 0.00 | 0.00 | 0.00 | 0.00 | 0.00 | 0.00 | 0.00 | 0.00 | 0.00 |
| Selling & Marketing | 122.00K | 39.00K | 42.00K | 23.00K | 165.00K | 121.00K | 17.00K | 0.00 | 19.00K | 0.00 | 0.00 | 0.00 | 0.00 | 0.00 | 0.00 | 0.00 | 0.00 | 0.00 | 0.00 | 0.00 | 0.00 | 0.00 | 0.00 | 0.00 | 0.00 | 0.00 | 0.00 | 0.00 | 0.00 | 0.00 | 0.00 | 0.00 |
| SG&A | 4.96M | 4.20M | 5.41M | 5.89M | 4.16M | 3.84M | 4.92M | 5.10M | 7.97M | 8.83M | 10.43M | 7.76M | 7.76M | 7.38M | 14.60M | 16.89M | 29.51M | 28.95M | 25.62M | 41.68M | 42.55M | 53.01M | 49.46M | 53.50M | 17.00M | 12.90M | 15.50M | 18.80M | 19.50M | 31.00M | 34.60M | 49.50M |
| Other Expenses | 0.00 | -34.00K | -207.00K | -83.00K | 0.00 | 27.00K | 60.00K | 199.00K | 367.00K | 661.00K | 864.00K | 1.36M | 1.35M | 1.64M | 3.13M | 5.76M | 0.00 | -64.80M | 0.00 | 0.00 | 0.00 | 0.00 | 0.00 | 0.00 | 1.31M | 1.20M | 1.80M | 2.90M | 3.70M | 3.90M | 7.30M | 6.40M |
| Operating Expenses | 4.96M | 4.16M | 5.20M | 5.81M | 4.16M | 3.87M | 4.98M | 5.30M | 8.34M | 9.49M | 11.30M | 9.11M | 9.12M | 9.02M | 17.73M | 22.65M | 29.51M | -35.85M | 25.62M | 41.68M | 42.55M | 53.01M | 49.46M | 53.50M | 18.30M | 14.10M | 17.30M | 21.70M | 23.20M | 34.90M | 41.90M | 55.90M |
| Cost & Expenses | 12.47M | 9.24M | 11.44M | 11.56M | 10.92M | 12.63M | 18.90M | 21.58M | 47.16M | 71.58M | 74.31M | 117.75M | 151.39M | 181.94M | 193.20M | 205.00M | 230.55M | 212.22M | 229.63M | 309.86M | 263.25M | 328.25M | 308.14M | 363.92M | 199.62M | 155.40M | 162.30M | 196.10M | 255.80M | 644.10M | 533.10M | 743.30M |
| Interest Income | 1.16M | 712.00K | 68.00K | 158.00K | 776.00K | 859.00K | 496.00K | 261.00K | 178.00K | 215.00K | 548.00K | 355.00K | 70.00K | 192.00K | 289.00K | 502.00K | 826.00K | 0.00 | 0.00 | 0.00 | 0.00 | 0.00 | 0.00 | 0.00 | 0.00 | 0.00 | 0.00 | 0.00 | 0.00 | 0.00 | 0.00 | 0.00 |
| Interest Expense | 5.00K | 10.00K | 11.00K | 7.00K | 0.00 | 859.00K | 4.00K | 261.00K | 178.00K | 215.00K | 6.00K | 15.00K | 23.00K | 160.00K | 313.00K | 257.00K | 523.00K | 0.00 | 0.00 | 0.00 | 0.00 | 0.00 | 0.00 | 0.00 | 0.00 | 0.00 | 0.00 | 0.00 | 0.00 | 0.00 | 0.00 | 0.00 |
| Depreciation & Amortization | 26.00K | 205.00K | 214.00K | 233.00K | 35.00K | 5.00K | 8.00K | 16.00K | 48.00K | 75.00K | 88.00K | 106.00K | 276.00K | 502.00K | 846.00K | 775.00K | 823.00K | 850.00K | 1.08M | 3.28M | 3.38M | 3.14M | 3.60M | 2.73M | 1.31M | 1.20M | 1.80M | 2.90M | 3.70M | 3.90M | 7.30M | 6.40M |
| EBITDA | 887.00K | -1.15M | -3.40M | -3.74M | -3.82M | -2.78M | -3.38M | -49.00K | -1.18M | 5.04M | -58.00K | 9.79M | 13.41M | 22.37M | 14.90M | -3.24M | -6.31M | 9.07M | 5.74M | 10.35M | 5.29M | 22.68M | 13.92M | 16.22M | 6.65M | 5.00M | 2.20M | -14.50M | -6.40M | 14.50M | -38.40M | 4.50M |
| EBITDA Ratio | 9.78% | -15.95% | -35.96% | -49.98% | -60.62% | -31.00% | -22.49% | -0.23% | -2.58% | 6.22% | 9.94% | 8.65% | 6.55% | 9.76% | 7.20% | -1.56% | -2.63% | 25.75% | 2.28% | 4.27% | 2.07% | 6.52% | 3.45% | 4.30% | 3.24% | 3.15% | 0.86% | -6.44% | -2.60% | 2.21% | -4.31% | 5.33% |
| Operating Income | -3.40M | -2.06M | -3.23M | -4.11M | -4.63M | -3.65M | -3.88M | -326.00K | -1.41M | 4.75M | 3.30M | 9.33M | 11.87M | 18.91M | 13.77M | -4.40M | -7.32M | 71.99M | 4.17M | 11.30M | -1.03M | 19.54M | 10.31M | 13.49M | 5.33M | 3.30M | 400.00K | -17.40M | -10.10M | 10.60M | -45.70M | -1.90M |
| Operating Income Ratio | -37.48% | -28.73% | -39.40% | -55.23% | -73.51% | -40.61% | -25.84% | -1.53% | -3.07% | 6.22% | 4.24% | 7.26% | 7.27% | 9.41% | 6.65% | -2.19% | -3.28% | 25.31% | 1.78% | 3.52% | -0.39% | 5.62% | 3.24% | 3.58% | 2.60% | 2.08% | 0.25% | -9.74% | -4.11% | 1.62% | -9.38% | -0.26% |
| Total Other Income/Expenses | 4.26M | 736.00K | -186.00K | 234.00K | 776.00K | 859.00K | 492.00K | 261.00K | 178.00K | 215.00K | -3.45M | 340.00K | 1.25M | 2.80M | -24.00K | 128.00K | -447.00K | -894.00K | -785.00K | -3.21M | -883.00K | -1.78M | 1.43M | -1.78M | -2.29M | -2.78M | -1.50M | -6.40M | 0.00 | -2.90M | -27.70M | -53.40M |
| Income Before Tax | 856.00K | -1.36M | -3.63M | -3.96M | -3.85M | -2.79M | -3.39M | -65.00K | -1.23M | 4.96M | -152.00K | 9.67M | 13.11M | 21.71M | 13.74M | -4.27M | -7.65M | 7.14M | 3.38M | 8.84M | -1.59M | 17.76M | 11.75M | 11.71M | 3.04M | 500.00K | -1.10M | -23.80M | 0.00 | 7.70M | -73.40M | -55.30M |
| Income Before Tax Ratio | 9.44% | -18.95% | -44.19% | -53.20% | -61.18% | -31.05% | -22.57% | -0.31% | -2.68% | 6.50% | -0.20% | 7.53% | 8.03% | 10.81% | 6.64% | -2.13% | -3.43% | 2.51% | 1.45% | 2.76% | -0.60% | 5.11% | 3.69% | 3.10% | 1.48% | 0.32% | -0.68% | -13.32% | 0.00% | 1.18% | -15.06% | -7.46% |
| Income Tax Expense | 90.00K | -702.00K | 11.00K | 15.00K | 457.00K | -352.00K | 3.46M | 172.00K | -259.00K | 3.07M | -1.47M | 3.67M | 2.48M | 5.79M | 2.37M | -90.00K | 1.43M | 3.68M | -328.00K | 2.98M | 2.15M | -9.29M | -7.66M | -944.00K | -577.00K | 200.00K | 300.00K | 200.00K | 3.30M | 300.00K | 300.00K | 700.00K |
| Net Income | 766.00K | -658.00K | -3.64M | -3.98M | -4.31M | -2.44M | -6.85M | -237.00K | -968.00K | 1.89M | 1.32M | 6.00M | 10.63M | 15.92M | 11.32M | -4.82M | -9.02M | 3.46M | 16.63M | 5.91M | -1.07M | 21.50M | 19.41M | 12.65M | 3.62M | 300.00K | -1.40M | -24.00M | -13.40M | 7.40M | 55.50M | -56.00M |
| Net Income Ratio | 8.45% | -9.17% | -44.32% | -53.40% | -68.44% | -27.13% | -45.61% | -1.12% | -2.12% | 2.48% | 1.69% | 4.67% | 6.51% | 7.93% | 5.47% | -2.40% | -4.04% | 1.22% | 7.11% | 1.84% | -0.41% | 6.18% | 6.09% | 3.35% | 1.77% | 0.19% | -0.86% | -13.43% | -5.45% | 1.13% | 11.39% | -7.55% |
| EPS | 0.04 | -0.03 | -0.17 | -0.19 | -0.20 | -0.11 | -0.27 | -0.01 | -0.04 | 0.07 | 0.05 | 0.22 | 0.39 | 0.59 | 0.42 | -0.18 | -0.33 | 0.13 | 0.61 | 0.22 | -0.04 | 0.78 | 0.62 | 0.36 | 0.07 | -0.01 | -0.03 | -0.60 | -0.35 | 0.25 | 1.43 | -1.47 |
| EPS Diluted | 0.04 | -0.03 | -0.17 | -0.19 | -0.20 | -0.11 | -0.27 | -0.01 | -0.04 | 0.07 | 0.05 | 0.22 | 0.39 | 0.59 | 0.42 | -0.18 | -0.33 | 0.13 | 0.61 | 0.22 | -0.04 | 0.75 | 0.52 | 0.33 | 0.07 | -0.01 | -0.03 | -0.60 | -0.35 | 0.16 | 1.43 | -1.47 |
| Weighted Avg Shares Out | 21.04M | 21.04M | 21.04M | 21.04M | 21.04M | 21.93M | 25.28M | 27.12M | 27.13M | 27.13M | 27.13M | 27.13M | 27.13M | 27.13M | 27.13M | 27.13M | 27.13M | 27.09M | 27.08M | 26.99M | 27.23M | 27.72M | 31.30M | 35.07M | 47.63M | 49.99M | 45.17M | 40.29M | 38.29M | 29.60M | 38.81M | 38.10M |
| Weighted Avg Shares Out (Dil) | 21.04M | 21.04M | 21.04M | 21.04M | 21.04M | 21.93M | 25.28M | 27.12M | 27.13M | 27.13M | 27.13M | 27.13M | 27.13M | 27.13M | 27.13M | 27.13M | 27.13M | 27.13M | 27.17M | 27.26M | 27.23M | 28.64M | 40.49M | 38.57M | 53.51M | 49.99M | 45.17M | 40.29M | 38.29M | 46.25M | 38.81M | 38.10M |

Emerson Invests in inmation Software

Stocks making the biggest moves in the premarket: Twitter, Alphabet, Regeneron, Sony & more

Emerson Reports Third Quarter 2020 Results and Raises Full Year 2020 Guidance

Emerson and MHPS Collaborate on Power Industry Digital Transformation

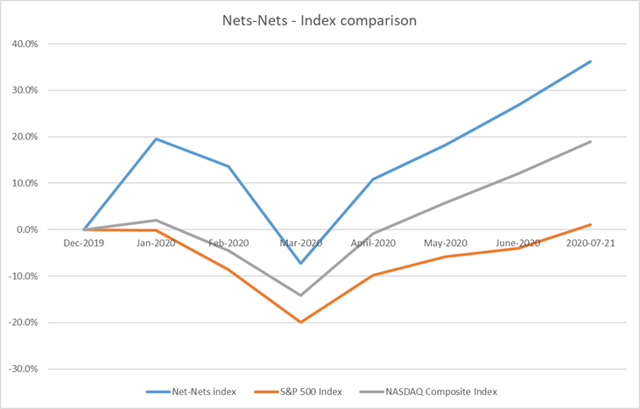
Deep Value Index Posts Strong Outperformance Vs. Nasdaq During COVID-19 Pandemic

Paramount acquires Lee Daniels drama on jazz legend Billie Holiday

Transfer news LIVE: Chelsea, Man Utd, Liverpool and Arsenal latest gossip

Un Betis herido recibe a un Villarreal en alza

Chelsea transfer round up: Havertz and Sancho decision, left-back raid

Leicester 0-1 Chelsea player ratings as Ross Barkley fires Blues to FA Cup semis
Source: https://incomestatements.info
Category: Stock Reports
