See more : Vista Pharmaceuticals Limited (VISTAPH.BO) Income Statement Analysis – Financial Results
Complete financial analysis of Emerson Radio Corp. (MSN) income statement, including revenue, profit margins, EPS and key performance metrics. Get detailed insights into the financial performance of Emerson Radio Corp., a leading company in the Consumer Electronics industry within the Technology sector.
- Lakeshore Acquisition II Corp. (LBBBU) Income Statement Analysis – Financial Results
- Oriental System Technology Inc. (6819.TWO) Income Statement Analysis – Financial Results
- ANZ Group Holdings Limited (X5Z.F) Income Statement Analysis – Financial Results
- PT Aneka Tambang Tbk (PAEKY) Income Statement Analysis – Financial Results
- Prima Plastics Limited (PRIMAPLA.BO) Income Statement Analysis – Financial Results
Emerson Radio Corp. (MSN)
About Emerson Radio Corp.
Emerson Radio Corp., together with its subsidiaries, designs, sources, imports, markets, and sells various houseware and consumer electronic products under the Emerson brand in the United States and internationally. It offers houseware products, such as microwave ovens, compact refrigerators, wine products, and toaster ovens; audio products, including clock radios, Bluetooth speakers, and wireless charging products; and other products comprising massagers, toothbrushes, and security products. The company also licenses its trademarks to others on a worldwide basis for various products. Emerson Radio Corp. markets its products primarily through mass merchandisers and online marketplaces. The company was founded in 1912 and is headquartered in Parsippany, New Jersey.
| Metric | 2024 | 2023 | 2022 | 2021 | 2020 | 2019 | 2018 | 2017 | 2016 | 2015 | 2014 | 2013 | 2012 | 2011 | 2010 | 2009 | 2008 | 2007 | 2006 | 2005 | 2004 | 2003 | 2002 | 2001 | 2000 | 1999 | 1998 | 1997 | 1996 | 1995 | 1994 | 1993 |
|---|---|---|---|---|---|---|---|---|---|---|---|---|---|---|---|---|---|---|---|---|---|---|---|---|---|---|---|---|---|---|---|---|
| Revenue | 9.07M | 7.18M | 8.21M | 7.45M | 6.29M | 8.98M | 15.02M | 21.25M | 45.75M | 76.32M | 77.83M | 128.40M | 163.25M | 200.84M | 206.96M | 200.60M | 223.23M | 284.40M | 233.84M | 320.70M | 263.77M | 347.78M | 318.45M | 377.41M | 204.96M | 158.70M | 162.70M | 178.70M | 245.70M | 654.70M | 487.40M | 741.40M |
| Cost of Revenue | 7.51M | 5.08M | 6.24M | 5.75M | 6.76M | 8.76M | 13.92M | 16.28M | 38.82M | 62.09M | 63.01M | 108.63M | 142.27M | 172.92M | 175.46M | 182.35M | 201.05M | 248.07M | 204.01M | 268.17M | 220.71M | 275.24M | 258.68M | 310.42M | 181.32M | 141.30M | 145.00M | 174.40M | 232.60M | 609.20M | 491.20M | 687.40M |
| Gross Profit | 1.56M | 2.10M | 1.97M | 1.70M | -462.00K | 222.00K | 1.10M | 4.97M | 6.93M | 14.24M | 14.82M | 19.77M | 20.98M | 27.92M | 31.50M | 18.25M | 22.18M | 36.33M | 29.83M | 52.53M | 43.07M | 72.55M | 59.77M | 66.99M | 23.64M | 17.40M | 17.70M | 4.30M | 13.10M | 45.50M | -3.80M | 54.00M |
| Gross Profit Ratio | 17.24% | 29.27% | 23.99% | 22.78% | -7.34% | 2.47% | 7.33% | 23.41% | 15.15% | 18.65% | 19.04% | 15.39% | 12.85% | 13.90% | 15.22% | 9.10% | 9.94% | 12.78% | 12.76% | 16.38% | 16.33% | 20.86% | 18.77% | 17.75% | 11.53% | 10.96% | 10.88% | 2.41% | 5.33% | 6.95% | -0.78% | 7.28% |
| Research & Development | 0.00 | 0.00 | 0.00 | 0.00 | 0.00 | 0.00 | 0.00 | 0.00 | 0.00 | 0.00 | 0.00 | 0.00 | 0.00 | 0.00 | 0.00 | 0.00 | 0.00 | 0.00 | 0.00 | 0.00 | 0.00 | 0.00 | 0.00 | 0.00 | 0.00 | 0.00 | 0.00 | 0.00 | 0.00 | 0.00 | 0.00 | 0.00 |
| General & Administrative | 4.84M | 4.16M | 5.37M | 5.87M | 4.00M | 3.72M | 4.91M | 0.00 | 7.95M | 0.00 | 0.00 | 0.00 | 0.00 | 0.00 | 0.00 | 0.00 | 0.00 | 0.00 | 0.00 | 0.00 | 0.00 | 0.00 | 0.00 | 0.00 | 0.00 | 0.00 | 0.00 | 0.00 | 0.00 | 0.00 | 0.00 | 0.00 |
| Selling & Marketing | 122.00K | 39.00K | 42.00K | 23.00K | 165.00K | 121.00K | 17.00K | 0.00 | 19.00K | 0.00 | 0.00 | 0.00 | 0.00 | 0.00 | 0.00 | 0.00 | 0.00 | 0.00 | 0.00 | 0.00 | 0.00 | 0.00 | 0.00 | 0.00 | 0.00 | 0.00 | 0.00 | 0.00 | 0.00 | 0.00 | 0.00 | 0.00 |
| SG&A | 4.96M | 4.20M | 5.41M | 5.89M | 4.16M | 3.84M | 4.92M | 5.10M | 7.97M | 8.83M | 10.43M | 7.76M | 7.76M | 7.38M | 14.60M | 16.89M | 29.51M | 28.95M | 25.62M | 41.68M | 42.55M | 53.01M | 49.46M | 53.50M | 17.00M | 12.90M | 15.50M | 18.80M | 19.50M | 31.00M | 34.60M | 49.50M |
| Other Expenses | 0.00 | -34.00K | -207.00K | -83.00K | 0.00 | 27.00K | 60.00K | 199.00K | 367.00K | 661.00K | 864.00K | 1.36M | 1.35M | 1.64M | 3.13M | 5.76M | 0.00 | -64.80M | 0.00 | 0.00 | 0.00 | 0.00 | 0.00 | 0.00 | 1.31M | 1.20M | 1.80M | 2.90M | 3.70M | 3.90M | 7.30M | 6.40M |
| Operating Expenses | 4.96M | 4.16M | 5.20M | 5.81M | 4.16M | 3.87M | 4.98M | 5.30M | 8.34M | 9.49M | 11.30M | 9.11M | 9.12M | 9.02M | 17.73M | 22.65M | 29.51M | -35.85M | 25.62M | 41.68M | 42.55M | 53.01M | 49.46M | 53.50M | 18.30M | 14.10M | 17.30M | 21.70M | 23.20M | 34.90M | 41.90M | 55.90M |
| Cost & Expenses | 12.47M | 9.24M | 11.44M | 11.56M | 10.92M | 12.63M | 18.90M | 21.58M | 47.16M | 71.58M | 74.31M | 117.75M | 151.39M | 181.94M | 193.20M | 205.00M | 230.55M | 212.22M | 229.63M | 309.86M | 263.25M | 328.25M | 308.14M | 363.92M | 199.62M | 155.40M | 162.30M | 196.10M | 255.80M | 644.10M | 533.10M | 743.30M |
| Interest Income | 1.16M | 712.00K | 68.00K | 158.00K | 776.00K | 859.00K | 496.00K | 261.00K | 178.00K | 215.00K | 548.00K | 355.00K | 70.00K | 192.00K | 289.00K | 502.00K | 826.00K | 0.00 | 0.00 | 0.00 | 0.00 | 0.00 | 0.00 | 0.00 | 0.00 | 0.00 | 0.00 | 0.00 | 0.00 | 0.00 | 0.00 | 0.00 |
| Interest Expense | 5.00K | 10.00K | 11.00K | 7.00K | 0.00 | 859.00K | 4.00K | 261.00K | 178.00K | 215.00K | 6.00K | 15.00K | 23.00K | 160.00K | 313.00K | 257.00K | 523.00K | 0.00 | 0.00 | 0.00 | 0.00 | 0.00 | 0.00 | 0.00 | 0.00 | 0.00 | 0.00 | 0.00 | 0.00 | 0.00 | 0.00 | 0.00 |
| Depreciation & Amortization | 26.00K | 205.00K | 214.00K | 233.00K | 35.00K | 5.00K | 8.00K | 16.00K | 48.00K | 75.00K | 88.00K | 106.00K | 276.00K | 502.00K | 846.00K | 775.00K | 823.00K | 850.00K | 1.08M | 3.28M | 3.38M | 3.14M | 3.60M | 2.73M | 1.31M | 1.20M | 1.80M | 2.90M | 3.70M | 3.90M | 7.30M | 6.40M |
| EBITDA | 887.00K | -1.15M | -3.40M | -3.74M | -3.82M | -2.78M | -3.38M | -49.00K | -1.18M | 5.04M | -58.00K | 9.79M | 13.41M | 22.37M | 14.90M | -3.24M | -6.31M | 9.07M | 5.74M | 10.35M | 5.29M | 22.68M | 13.92M | 16.22M | 6.65M | 5.00M | 2.20M | -14.50M | -6.40M | 14.50M | -38.40M | 4.50M |
| EBITDA Ratio | 9.78% | -15.95% | -35.96% | -49.98% | -60.62% | -31.00% | -22.49% | -0.23% | -2.58% | 6.22% | 9.94% | 8.65% | 6.55% | 9.76% | 7.20% | -1.56% | -2.63% | 25.75% | 2.28% | 4.27% | 2.07% | 6.52% | 3.45% | 4.30% | 3.24% | 3.15% | 0.86% | -6.44% | -2.60% | 2.21% | -4.31% | 5.33% |
| Operating Income | -3.40M | -2.06M | -3.23M | -4.11M | -4.63M | -3.65M | -3.88M | -326.00K | -1.41M | 4.75M | 3.30M | 9.33M | 11.87M | 18.91M | 13.77M | -4.40M | -7.32M | 71.99M | 4.17M | 11.30M | -1.03M | 19.54M | 10.31M | 13.49M | 5.33M | 3.30M | 400.00K | -17.40M | -10.10M | 10.60M | -45.70M | -1.90M |
| Operating Income Ratio | -37.48% | -28.73% | -39.40% | -55.23% | -73.51% | -40.61% | -25.84% | -1.53% | -3.07% | 6.22% | 4.24% | 7.26% | 7.27% | 9.41% | 6.65% | -2.19% | -3.28% | 25.31% | 1.78% | 3.52% | -0.39% | 5.62% | 3.24% | 3.58% | 2.60% | 2.08% | 0.25% | -9.74% | -4.11% | 1.62% | -9.38% | -0.26% |
| Total Other Income/Expenses | 4.26M | 736.00K | -186.00K | 234.00K | 776.00K | 859.00K | 492.00K | 261.00K | 178.00K | 215.00K | -3.45M | 340.00K | 1.25M | 2.80M | -24.00K | 128.00K | -447.00K | -894.00K | -785.00K | -3.21M | -883.00K | -1.78M | 1.43M | -1.78M | -2.29M | -2.78M | -1.50M | -6.40M | 0.00 | -2.90M | -27.70M | -53.40M |
| Income Before Tax | 856.00K | -1.36M | -3.63M | -3.96M | -3.85M | -2.79M | -3.39M | -65.00K | -1.23M | 4.96M | -152.00K | 9.67M | 13.11M | 21.71M | 13.74M | -4.27M | -7.65M | 7.14M | 3.38M | 8.84M | -1.59M | 17.76M | 11.75M | 11.71M | 3.04M | 500.00K | -1.10M | -23.80M | 0.00 | 7.70M | -73.40M | -55.30M |
| Income Before Tax Ratio | 9.44% | -18.95% | -44.19% | -53.20% | -61.18% | -31.05% | -22.57% | -0.31% | -2.68% | 6.50% | -0.20% | 7.53% | 8.03% | 10.81% | 6.64% | -2.13% | -3.43% | 2.51% | 1.45% | 2.76% | -0.60% | 5.11% | 3.69% | 3.10% | 1.48% | 0.32% | -0.68% | -13.32% | 0.00% | 1.18% | -15.06% | -7.46% |
| Income Tax Expense | 90.00K | -702.00K | 11.00K | 15.00K | 457.00K | -352.00K | 3.46M | 172.00K | -259.00K | 3.07M | -1.47M | 3.67M | 2.48M | 5.79M | 2.37M | -90.00K | 1.43M | 3.68M | -328.00K | 2.98M | 2.15M | -9.29M | -7.66M | -944.00K | -577.00K | 200.00K | 300.00K | 200.00K | 3.30M | 300.00K | 300.00K | 700.00K |
| Net Income | 766.00K | -658.00K | -3.64M | -3.98M | -4.31M | -2.44M | -6.85M | -237.00K | -968.00K | 1.89M | 1.32M | 6.00M | 10.63M | 15.92M | 11.32M | -4.82M | -9.02M | 3.46M | 16.63M | 5.91M | -1.07M | 21.50M | 19.41M | 12.65M | 3.62M | 300.00K | -1.40M | -24.00M | -13.40M | 7.40M | 55.50M | -56.00M |
| Net Income Ratio | 8.45% | -9.17% | -44.32% | -53.40% | -68.44% | -27.13% | -45.61% | -1.12% | -2.12% | 2.48% | 1.69% | 4.67% | 6.51% | 7.93% | 5.47% | -2.40% | -4.04% | 1.22% | 7.11% | 1.84% | -0.41% | 6.18% | 6.09% | 3.35% | 1.77% | 0.19% | -0.86% | -13.43% | -5.45% | 1.13% | 11.39% | -7.55% |
| EPS | 0.04 | -0.03 | -0.17 | -0.19 | -0.20 | -0.11 | -0.27 | -0.01 | -0.04 | 0.07 | 0.05 | 0.22 | 0.39 | 0.59 | 0.42 | -0.18 | -0.33 | 0.13 | 0.61 | 0.22 | -0.04 | 0.78 | 0.62 | 0.36 | 0.07 | -0.01 | -0.03 | -0.60 | -0.35 | 0.25 | 1.43 | -1.47 |
| EPS Diluted | 0.04 | -0.03 | -0.17 | -0.19 | -0.20 | -0.11 | -0.27 | -0.01 | -0.04 | 0.07 | 0.05 | 0.22 | 0.39 | 0.59 | 0.42 | -0.18 | -0.33 | 0.13 | 0.61 | 0.22 | -0.04 | 0.75 | 0.52 | 0.33 | 0.07 | -0.01 | -0.03 | -0.60 | -0.35 | 0.16 | 1.43 | -1.47 |
| Weighted Avg Shares Out | 21.04M | 21.04M | 21.04M | 21.04M | 21.04M | 21.93M | 25.28M | 27.12M | 27.13M | 27.13M | 27.13M | 27.13M | 27.13M | 27.13M | 27.13M | 27.13M | 27.13M | 27.09M | 27.08M | 26.99M | 27.23M | 27.72M | 31.30M | 35.07M | 47.63M | 49.99M | 45.17M | 40.29M | 38.29M | 29.60M | 38.81M | 38.10M |
| Weighted Avg Shares Out (Dil) | 21.04M | 21.04M | 21.04M | 21.04M | 21.04M | 21.93M | 25.28M | 27.12M | 27.13M | 27.13M | 27.13M | 27.13M | 27.13M | 27.13M | 27.13M | 27.13M | 27.13M | 27.13M | 27.17M | 27.26M | 27.23M | 28.64M | 40.49M | 38.57M | 53.51M | 49.99M | 45.17M | 40.29M | 38.29M | 46.25M | 38.81M | 38.10M |
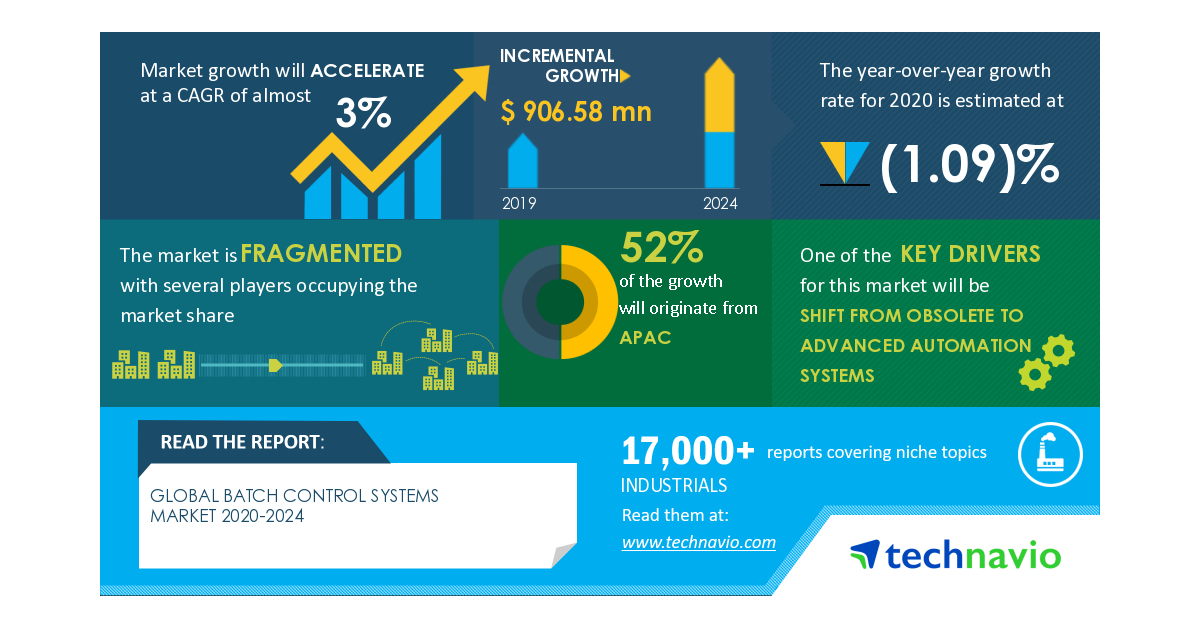
Global Batch Control Systems Market: COVID-19 Business Continuity Plan | Evolving Opportunities With ABB Ltd. and Automated Process Equipment Corp. | Technavio

Scott Cooper Miami Project Awards Scholarship to Texas A&M University Student
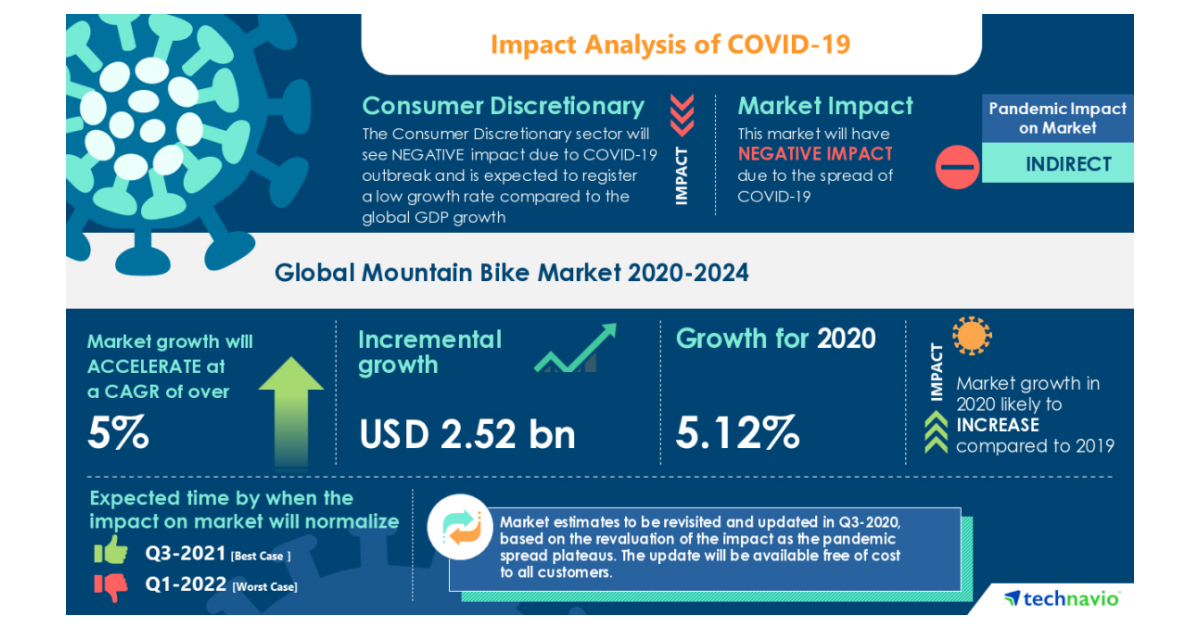
Mountain Bike Market- Roadmap for Recovery from COVID-19 | Rise In Women Mountain Bikers to Boost the Market Growth | Technavio
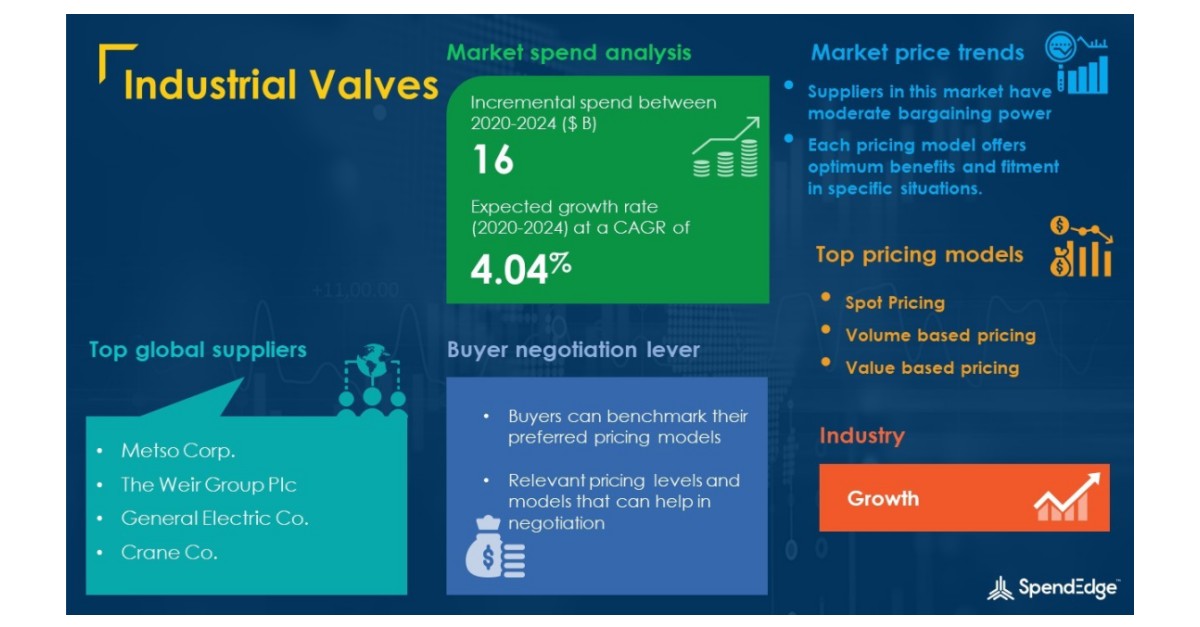
Industrial Valves Market Procurement Intelligence Report with COVID-19 Impact Analysis | Global Forecasts, 2020-2024

Scott Darling Sells 4,000 Shares of Stitch Fix Inc (NASDAQ:SFIX) Stock
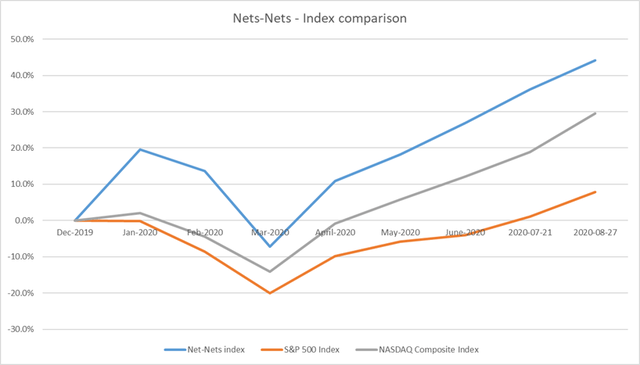
Deep Value Index Outperforms Nasdaq 14.6% Year-To-Date - Model Portfolio Update

Teza Capital Management LLC Buys Shares of 4,129 Emerson Electric Co. (NYSE:EMR)
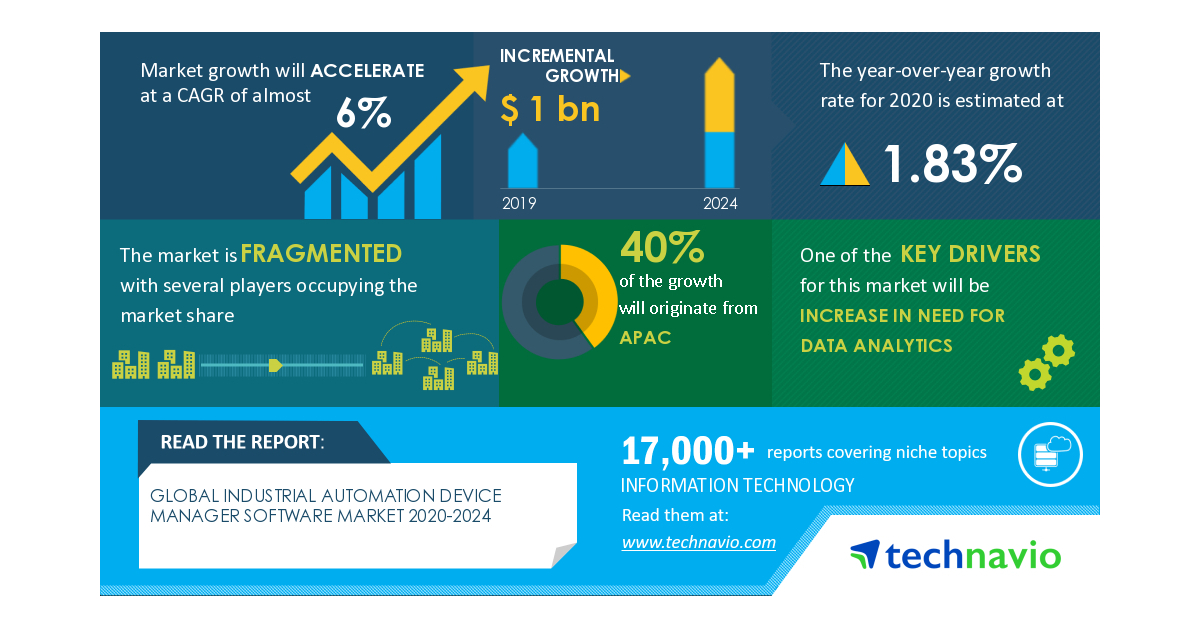
COVID-19 Impacts: Industrial Automation Device Manager Software Market Will Accelerate at a CAGR of Almost 6% Through 2020-2024 | Increase in Need for Data Analytics to Boost Growth | Technavio

These ‘Dividend Aristocrat’ stocks have been raising their dividends for decades, and there have been no dividend cuts during the pandemic
Source: https://incomestatements.info
Category: Stock Reports

