See more : Extreme Networks, Inc. (EXTR) Income Statement Analysis – Financial Results
Complete financial analysis of Tharisa plc (TIHRF) income statement, including revenue, profit margins, EPS and key performance metrics. Get detailed insights into the financial performance of Tharisa plc, a leading company in the Other Precious Metals industry within the Basic Materials sector.
- Waterloo Brewing Ltd. (WBR.TO) Income Statement Analysis – Financial Results
- King Stone Energy Group Limited (0663.HK) Income Statement Analysis – Financial Results
- K+S Aktiengesellschaft (SDF.DE) Income Statement Analysis – Financial Results
- Scion Tech Growth I (SCOAW) Income Statement Analysis – Financial Results
- Pernod Ricard SA (RI.SW) Income Statement Analysis – Financial Results
Tharisa plc (TIHRF)
About Tharisa plc
Tharisa plc, an investment holding company, engages in the mining, processing, beneficiation, marketing, sale, and logistics of platinum group metals (PGM) and chrome concentrates in South Africa, China, Singapore, Hong Kong, Australia, Japan, and internationally. It operates through four segments: PGM, Chrome, Agency and Trading, and Manufacturing. The company's PGM basket includes platinum, palladium, rhodium, gold, ruthenium, iridium, nickel, and copper. It holds 100% interest in the Tharisa mine, an open pit PGM and chrome mine located on the south-western limb of the Bushveld Complex, South Africa. The company also offers chemical and foundry grade chrome concentrates; and metallurgical grade chrome concentrate for stainless steel and ferrochrome producers, as well as commodity traders. In addition, it is involved the manufacturing of mining equipment. The company was incorporated in 2008 and is based in Paphos, Cyprus.
| Metric | 2024 | 2023 | 2022 | 2021 | 2020 | 2019 | 2018 | 2017 | 2016 | 2015 | 2014 | 2013 | 2012 |
|---|---|---|---|---|---|---|---|---|---|---|---|---|---|
| Revenue | 721.39M | 621.52M | 596.29M | 586.43M | 395.20M | 324.33M | 375.76M | 346.14M | 235.86M | 246.78M | 240.73M | 215.46M | 53.89M |
| Cost of Revenue | 536.79M | 475.07M | 385.04M | 380.10M | 267.14M | 265.11M | 273.53M | 225.58M | 178.06M | 203.69M | 208.12M | 189.57M | 62.11M |
| Gross Profit | 184.61M | 146.45M | 211.25M | 206.33M | 128.06M | 59.22M | 102.22M | 120.56M | 57.79M | 43.09M | 32.61M | 25.89M | -8.23M |
| Gross Profit Ratio | 25.59% | 23.56% | 35.43% | 35.18% | 32.40% | 18.26% | 27.20% | 34.83% | 24.50% | 17.46% | 13.55% | 12.01% | -15.26% |
| Research & Development | 1.03M | 1.25M | 601.51K | 594.94K | 178.13K | 332.00K | 235.00K | 0.00 | 0.00 | 0.00 | 0.00 | 0.00 | 0.00 |
| General & Administrative | 19.55M | 16.96M | 13.82M | 12.62M | 9.63M | 11.87M | 11.41M | 8.49M | 7.79M | 8.35M | 11.06M | 26.60M | 25.96M |
| Selling & Marketing | 0.00 | 33.40M | 333.00K | 94.00K | 304.00K | 702.00K | 410.00K | 358.00K | 285.00K | 580.00K | 767.00K | 0.00 | 0.00 |
| SG&A | 19.55M | 50.36M | 41.52M | 41.36M | 33.22M | 33.93M | 34.79M | 25.55M | 22.41M | 8.93M | 11.83M | 26.60M | 25.96M |
| Other Expenses | 44.48M | 0.00 | -735.00K | -346.00K | 7.00K | 7.00K | 14.00K | 0.00 | 0.00 | 0.00 | 0.00 | 0.00 | 0.00 |
| Operating Expenses | 65.05M | 51.32M | 42.12M | 41.95M | 33.40M | 34.26M | 34.79M | 25.55M | 22.41M | 24.73M | 26.76M | 26.55M | 25.29M |
| Cost & Expenses | 601.84M | 526.38M | 427.16M | 422.05M | 300.54M | 299.37M | 308.33M | 251.14M | 200.47M | 228.42M | 234.88M | 216.12M | 87.41M |
| Interest Income | 8.60M | 1.14M | 1.20M | 1.37M | 918.90K | 1.36M | 1.28M | 1.12M | 770.00K | 1.19M | 897.00K | 863.00K | 2.13M |
| Interest Expense | 11.88M | 7.10M | 3.30M | 4.09M | 5.67M | 7.26M | 10.19M | 7.69M | 11.82M | 11.86M | 14.00M | 14.74M | 1.60M |
| Depreciation & Amortization | 54.73M | 39.24M | 35.24M | 36.94M | 28.28M | 26.84M | 28.30M | 17.26M | 11.27M | 10.26M | 10.76M | 12.44M | 5.16M |
| EBITDA | 184.28M | 154.37M | 204.37M | 201.32M | 108.28M | 46.21M | 97.20M | 112.26M | 45.64M | 29.80M | -15.04M | -33.39M | -31.78M |
| EBITDA Ratio | 25.55% | 24.84% | 34.27% | 34.33% | 31.11% | 15.97% | 25.48% | 32.43% | 19.78% | 12.07% | -6.19% | -16.61% | -59.18% |
| Operating Income | 119.56M | 94.69M | 169.13M | 164.38M | 94.66M | 24.96M | 67.43M | 95.00M | 35.39M | 18.36M | 5.85M | -663.00K | -33.52M |
| Operating Income Ratio | 16.57% | 15.24% | 28.36% | 28.03% | 23.95% | 7.70% | 17.95% | 27.45% | 15.00% | 7.44% | 2.43% | -0.31% | -62.20% |
| Total Other Income/Expenses | -1.88M | 19.65M | 11.42M | 3.58M | -11.89M | -12.10M | -8.47M | -7.38M | -10.27M | -8.72M | -46.18M | -62.31M | -5.13M |
| Income Before Tax | 117.68M | 114.34M | 195.97M | 182.42M | 74.34M | 12.11M | 60.16M | 90.13M | 23.59M | 9.63M | -40.33M | -62.97M | -38.65M |
| Income Before Tax Ratio | 16.31% | 18.40% | 32.86% | 31.11% | 18.81% | 3.74% | 16.01% | 26.04% | 10.00% | 3.90% | -16.75% | -29.23% | -71.72% |
| Income Tax Expense | 35.04M | 27.56M | 46.13M | 52.82M | 20.25M | 2.63M | 12.96M | 23.10M | 6.63M | 3.62M | 14.55M | -15.53M | -8.68M |
| Net Income | 82.90M | 82.24M | 153.88M | 100.47M | 43.30M | 10.62M | 48.43M | 57.60M | 13.81M | 4.62M | -49.00M | -38.93M | -20.95M |
| Net Income Ratio | 11.49% | 13.23% | 25.81% | 17.13% | 10.96% | 3.27% | 12.89% | 16.64% | 5.85% | 1.87% | -20.35% | -18.07% | -38.88% |
| EPS | 0.28 | 0.27 | 0.47 | 0.37 | 0.16 | 0.04 | 0.19 | 0.22 | 0.05 | 0.02 | -0.20 | -0.16 | -0.09 |
| EPS Diluted | 0.27 | 0.27 | 0.47 | 0.37 | 0.16 | 0.04 | 0.18 | 0.22 | 0.05 | 0.02 | -0.20 | -0.16 | -0.09 |
| Weighted Avg Shares Out | 299.07M | 299.82M | 285.78M | 268.86M | 266.61M | 263.13M | 260.33M | 257.39M | 256.18M | 255.08M | 247.88M | 241.59M | 241.59M |
| Weighted Avg Shares Out (Dil) | 307.49M | 302.71M | 285.90M | 269.46M | 267.36M | 264.88M | 264.53M | 257.39M | 256.18M | 255.08M | 247.88M | 241.59M | 241.59M |

Tharisa says it performed well in second quarter, marks 10 years on JSE

Tharisa says it performed well in second quarter, marks 10 years on JSE

Tharisa launches $5mln share buyback programme
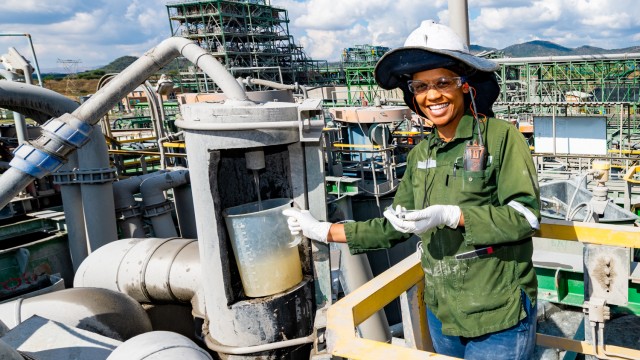
Tharisa increases production in first quarter, record for chrome output

Platinum producer Tharisa's FY23 profit falls amid operational challenges, rising costs and weak prices

Tharisa's ‘positive dividend surprise' exceeds expectations - analyst
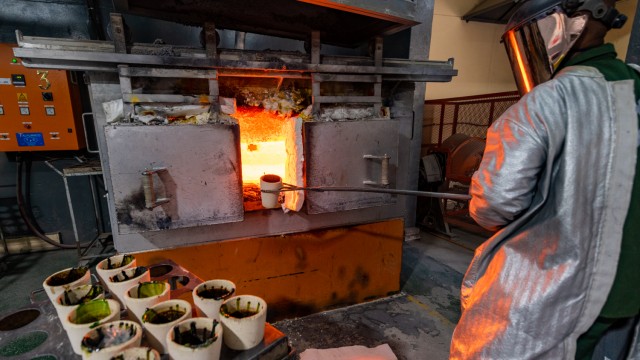
Tharisa battens down as platinum falls out of favour

Tharisa confirms impact of weak platinum price
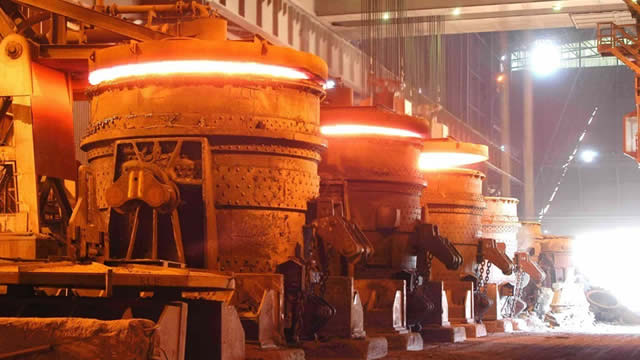
South African platinum producer Tharisa says FY23 output down due to operational challenges
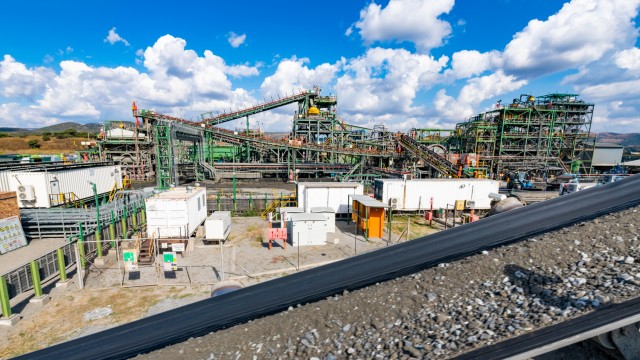
Tharisa Karo delay makes sense suggests broker
Source: https://incomestatements.info
Category: Stock Reports
