See more : Jungheinrich Aktiengesellschaft (JUN3.DE) Income Statement Analysis – Financial Results
Complete financial analysis of Tharisa plc (TIHRF) income statement, including revenue, profit margins, EPS and key performance metrics. Get detailed insights into the financial performance of Tharisa plc, a leading company in the Other Precious Metals industry within the Basic Materials sector.
- TUHU Car Inc (9690.HK) Income Statement Analysis – Financial Results
- Montnets Cloud Technology Group Co., Ltd. (002123.SZ) Income Statement Analysis – Financial Results
- HFCL Limited (HFCL.NS) Income Statement Analysis – Financial Results
- Nomura Real Estate Master Fund, Inc. (NMMRF) Income Statement Analysis – Financial Results
- Monster Beverage Corporation (MNST) Income Statement Analysis – Financial Results
Tharisa plc (TIHRF)
About Tharisa plc
Tharisa plc, an investment holding company, engages in the mining, processing, beneficiation, marketing, sale, and logistics of platinum group metals (PGM) and chrome concentrates in South Africa, China, Singapore, Hong Kong, Australia, Japan, and internationally. It operates through four segments: PGM, Chrome, Agency and Trading, and Manufacturing. The company's PGM basket includes platinum, palladium, rhodium, gold, ruthenium, iridium, nickel, and copper. It holds 100% interest in the Tharisa mine, an open pit PGM and chrome mine located on the south-western limb of the Bushveld Complex, South Africa. The company also offers chemical and foundry grade chrome concentrates; and metallurgical grade chrome concentrate for stainless steel and ferrochrome producers, as well as commodity traders. In addition, it is involved the manufacturing of mining equipment. The company was incorporated in 2008 and is based in Paphos, Cyprus.
| Metric | 2024 | 2023 | 2022 | 2021 | 2020 | 2019 | 2018 | 2017 | 2016 | 2015 | 2014 | 2013 | 2012 |
|---|---|---|---|---|---|---|---|---|---|---|---|---|---|
| Revenue | 721.39M | 621.52M | 596.29M | 586.43M | 395.20M | 324.33M | 375.76M | 346.14M | 235.86M | 246.78M | 240.73M | 215.46M | 53.89M |
| Cost of Revenue | 536.79M | 475.07M | 385.04M | 380.10M | 267.14M | 265.11M | 273.53M | 225.58M | 178.06M | 203.69M | 208.12M | 189.57M | 62.11M |
| Gross Profit | 184.61M | 146.45M | 211.25M | 206.33M | 128.06M | 59.22M | 102.22M | 120.56M | 57.79M | 43.09M | 32.61M | 25.89M | -8.23M |
| Gross Profit Ratio | 25.59% | 23.56% | 35.43% | 35.18% | 32.40% | 18.26% | 27.20% | 34.83% | 24.50% | 17.46% | 13.55% | 12.01% | -15.26% |
| Research & Development | 1.03M | 1.25M | 601.51K | 594.94K | 178.13K | 332.00K | 235.00K | 0.00 | 0.00 | 0.00 | 0.00 | 0.00 | 0.00 |
| General & Administrative | 19.55M | 16.96M | 13.82M | 12.62M | 9.63M | 11.87M | 11.41M | 8.49M | 7.79M | 8.35M | 11.06M | 26.60M | 25.96M |
| Selling & Marketing | 0.00 | 33.40M | 333.00K | 94.00K | 304.00K | 702.00K | 410.00K | 358.00K | 285.00K | 580.00K | 767.00K | 0.00 | 0.00 |
| SG&A | 19.55M | 50.36M | 41.52M | 41.36M | 33.22M | 33.93M | 34.79M | 25.55M | 22.41M | 8.93M | 11.83M | 26.60M | 25.96M |
| Other Expenses | 44.48M | 0.00 | -735.00K | -346.00K | 7.00K | 7.00K | 14.00K | 0.00 | 0.00 | 0.00 | 0.00 | 0.00 | 0.00 |
| Operating Expenses | 65.05M | 51.32M | 42.12M | 41.95M | 33.40M | 34.26M | 34.79M | 25.55M | 22.41M | 24.73M | 26.76M | 26.55M | 25.29M |
| Cost & Expenses | 601.84M | 526.38M | 427.16M | 422.05M | 300.54M | 299.37M | 308.33M | 251.14M | 200.47M | 228.42M | 234.88M | 216.12M | 87.41M |
| Interest Income | 8.60M | 1.14M | 1.20M | 1.37M | 918.90K | 1.36M | 1.28M | 1.12M | 770.00K | 1.19M | 897.00K | 863.00K | 2.13M |
| Interest Expense | 11.88M | 7.10M | 3.30M | 4.09M | 5.67M | 7.26M | 10.19M | 7.69M | 11.82M | 11.86M | 14.00M | 14.74M | 1.60M |
| Depreciation & Amortization | 54.73M | 39.24M | 35.24M | 36.94M | 28.28M | 26.84M | 28.30M | 17.26M | 11.27M | 10.26M | 10.76M | 12.44M | 5.16M |
| EBITDA | 184.28M | 154.37M | 204.37M | 201.32M | 108.28M | 46.21M | 97.20M | 112.26M | 45.64M | 29.80M | -15.04M | -33.39M | -31.78M |
| EBITDA Ratio | 25.55% | 24.84% | 34.27% | 34.33% | 31.11% | 15.97% | 25.48% | 32.43% | 19.78% | 12.07% | -6.19% | -16.61% | -59.18% |
| Operating Income | 119.56M | 94.69M | 169.13M | 164.38M | 94.66M | 24.96M | 67.43M | 95.00M | 35.39M | 18.36M | 5.85M | -663.00K | -33.52M |
| Operating Income Ratio | 16.57% | 15.24% | 28.36% | 28.03% | 23.95% | 7.70% | 17.95% | 27.45% | 15.00% | 7.44% | 2.43% | -0.31% | -62.20% |
| Total Other Income/Expenses | -1.88M | 19.65M | 11.42M | 3.58M | -11.89M | -12.10M | -8.47M | -7.38M | -10.27M | -8.72M | -46.18M | -62.31M | -5.13M |
| Income Before Tax | 117.68M | 114.34M | 195.97M | 182.42M | 74.34M | 12.11M | 60.16M | 90.13M | 23.59M | 9.63M | -40.33M | -62.97M | -38.65M |
| Income Before Tax Ratio | 16.31% | 18.40% | 32.86% | 31.11% | 18.81% | 3.74% | 16.01% | 26.04% | 10.00% | 3.90% | -16.75% | -29.23% | -71.72% |
| Income Tax Expense | 35.04M | 27.56M | 46.13M | 52.82M | 20.25M | 2.63M | 12.96M | 23.10M | 6.63M | 3.62M | 14.55M | -15.53M | -8.68M |
| Net Income | 82.90M | 82.24M | 153.88M | 100.47M | 43.30M | 10.62M | 48.43M | 57.60M | 13.81M | 4.62M | -49.00M | -38.93M | -20.95M |
| Net Income Ratio | 11.49% | 13.23% | 25.81% | 17.13% | 10.96% | 3.27% | 12.89% | 16.64% | 5.85% | 1.87% | -20.35% | -18.07% | -38.88% |
| EPS | 0.28 | 0.27 | 0.47 | 0.37 | 0.16 | 0.04 | 0.19 | 0.22 | 0.05 | 0.02 | -0.20 | -0.16 | -0.09 |
| EPS Diluted | 0.27 | 0.27 | 0.47 | 0.37 | 0.16 | 0.04 | 0.18 | 0.22 | 0.05 | 0.02 | -0.20 | -0.16 | -0.09 |
| Weighted Avg Shares Out | 299.07M | 299.82M | 285.78M | 268.86M | 266.61M | 263.13M | 260.33M | 257.39M | 256.18M | 255.08M | 247.88M | 241.59M | 241.59M |
| Weighted Avg Shares Out (Dil) | 307.49M | 302.71M | 285.90M | 269.46M | 267.36M | 264.88M | 264.53M | 257.39M | 256.18M | 255.08M | 247.88M | 241.59M | 241.59M |
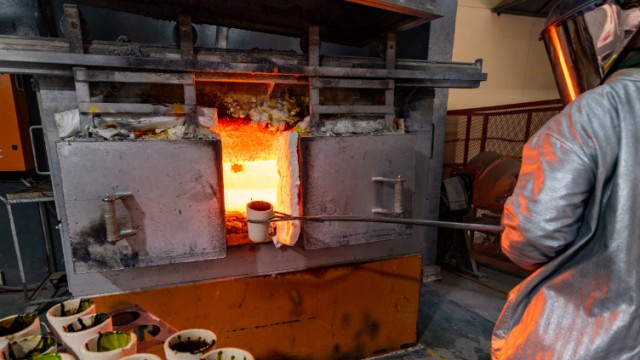
Tharisa ends year with more cash, extends timeline for Karo platinum project
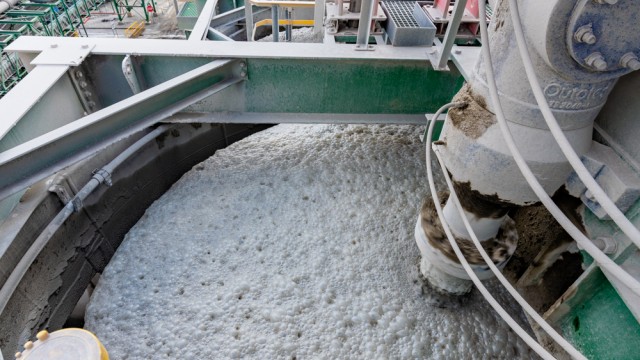
Tharisa says Karo first concrete poured with metal testing underway
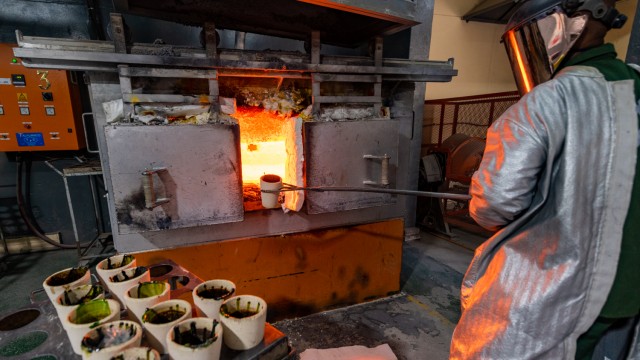
Tharisa sees good cash generation in latest quarter
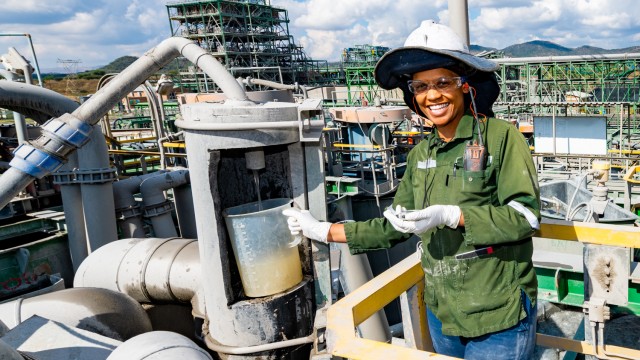
Tharisa first half helped by buoyant chrome price
South African platinum producer Tharisa expects 45-48% decline in HY basic earnings
Tharisa grows net cash, on track for sustainable production
Tharisa reinforces financial position with new debt, as construction at Karo continues
Tharisa PLC secures US$130mln debt facility with SocGen and Absa
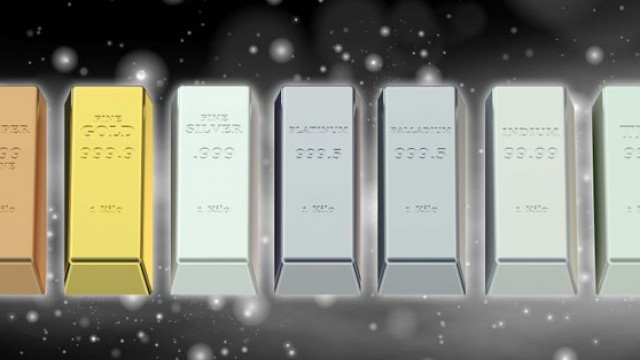
Tharisa says growth strategy firmly on track for 2023 as it reveals Q1 production and cash balance results
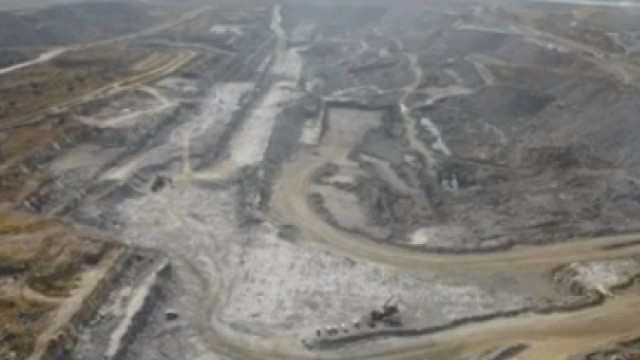
Tharisa says start of construction at the Karo Platinum Project officially recognised in a ceremony
Source: https://incomestatements.info
Category: Stock Reports
