See more : Gujarat Terce Laboratories Limited (GUJTERC.BO) Income Statement Analysis – Financial Results
Complete financial analysis of Volta Inc. (VLTA) income statement, including revenue, profit margins, EPS and key performance metrics. Get detailed insights into the financial performance of Volta Inc., a leading company in the Specialty Retail industry within the Consumer Cyclical sector.
- Olam International Limited (O32.SI) Income Statement Analysis – Financial Results
- MIGALO HOLDINGS Inc. (5535.T) Income Statement Analysis – Financial Results
- Apex Development Public Company Limited (APEX.BK) Income Statement Analysis – Financial Results
- CMS Info Systems Limited (CMSINFO.BO) Income Statement Analysis – Financial Results
- Avcorp Industries Inc. (AVP.TO) Income Statement Analysis – Financial Results
Volta Inc. (VLTA)
About Volta Inc.
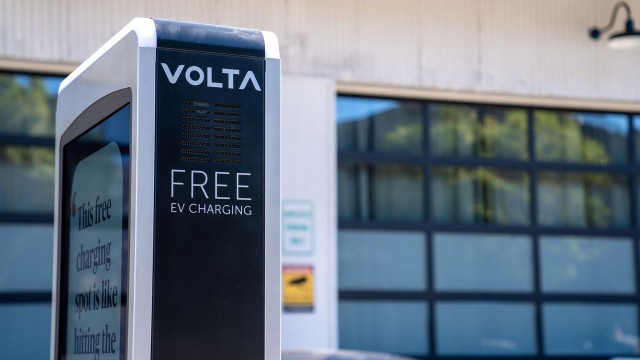
Volta Inc. operates a network of smart media-enabled charging stations for electric vehicles in the United States. As of December 31, 2021, it had installed 2,264 chargers across 23 territories and states. Volta Inc. was founded in 2010 and is headquartered in San Francisco, California.
| Metric | 2022 | 2021 | 2020 |
|---|---|---|---|
| Revenue | 54.60M | 32.31M | 19.45M |
| Cost of Revenue | 38.75M | 24.71M | 20.07M |
| Gross Profit | 15.85M | 7.60M | -622.00K |
| Gross Profit Ratio | 29.03% | 23.53% | -3.20% |
| Research & Development | 0.00 | 0.00 | 0.00 |
| General & Administrative | 0.00 | 0.00 | 0.00 |
| Selling & Marketing | 0.00 | 0.00 | 0.00 |
| SG&A | 165.33M | 262.63M | 44.08M |
| Other Expenses | 0.00 | 13.18M | 6.57M |
| Operating Expenses | 165.33M | 275.81M | 50.65M |
| Cost & Expenses | 226.67M | 300.51M | 70.73M |
| Interest Income | 0.00 | 0.00 | 0.00 |
| Interest Expense | 5.54M | 6.40M | 18.27M |
| Depreciation & Amortization | 19.28M | 10.44M | 5.88M |
| EBITDA | -129.82M | -257.76M | -45.39M |
| EBITDA Ratio | -237.76% | -797.75% | -233.37% |
| Operating Income | -149.10M | -268.20M | -51.27M |
| Operating Income Ratio | -273.07% | -830.07% | -263.61% |
| Total Other Income/Expenses | -5.54M | -8.35M | -19.27M |
| Income Before Tax | -154.63M | -276.56M | -70.55M |
| Income Before Tax Ratio | -283.21% | -855.92% | -362.69% |
| Income Tax Expense | 2.00K | 39.00K | 9.00K |
| Net Income | -154.63M | -276.60M | -70.56M |
| Net Income Ratio | -283.21% | -856.04% | -362.73% |
| EPS | -2.29 | -4.10 | -44.78 |
| EPS Diluted | -2.29 | -4.10 | -44.78 |
| Weighted Avg Shares Out | 67.43M | 67.43M | 1.58M |
| Weighted Avg Shares Out (Dil) | 67.43M | 67.43M | 1.58M |

Volta Inc (VLTA) CEO Scott Mercer on Q3 2021 Results - Earnings Call Transcript

Volta Inc. Reports Financial Results for Third Quarter 2021

Why Volta Shares Jumped Again Today

Why Lucid, ChargePoint, and Volta Stocks Soared Monday

5 Infrastructure Stocks To Watch As The $1 Trillion Infrastructure Bill Advances

Volta (VLTA) Stock: Why The Price Increased Today

Why Volta Stock Charged Up Friday

Volta Inc. Announces Third Quarter 2021 Earnings Release Date and Conference Call

Volta to offer EV charging stations at Floor & Decor warehouses

Volta Partners With Floor & Decor to Provide Electric Vehicle Charging
Source: https://incomestatements.info
Category: Stock Reports
