See more : DocGo Inc. (DCGOW) Income Statement Analysis – Financial Results
Complete financial analysis of Volta Inc. (VLTA) income statement, including revenue, profit margins, EPS and key performance metrics. Get detailed insights into the financial performance of Volta Inc., a leading company in the Specialty Retail industry within the Consumer Cyclical sector.
- Com2uS Corporation (078340.KQ) Income Statement Analysis – Financial Results
- Pact Group Holdings Ltd (PCTGY) Income Statement Analysis – Financial Results
- Continental Energy Corporation (CPPXF) Income Statement Analysis – Financial Results
- Canadian Imperial Bank of Commerce (CM-PT.TO) Income Statement Analysis – Financial Results
- Duksung Co., Ltd. (004835.KS) Income Statement Analysis – Financial Results
Volta Inc. (VLTA)
About Volta Inc.
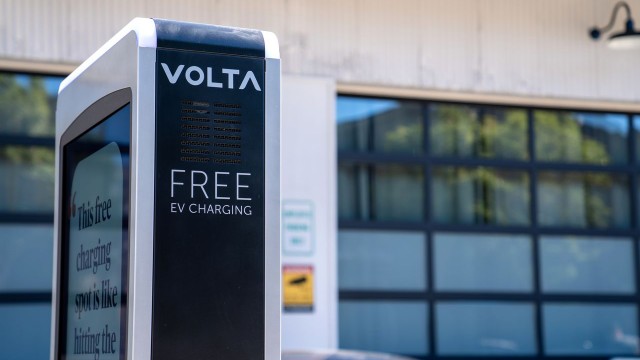
Volta Inc. operates a network of smart media-enabled charging stations for electric vehicles in the United States. As of December 31, 2021, it had installed 2,264 chargers across 23 territories and states. Volta Inc. was founded in 2010 and is headquartered in San Francisco, California.
| Metric | 2022 | 2021 | 2020 |
|---|---|---|---|
| Revenue | 54.60M | 32.31M | 19.45M |
| Cost of Revenue | 38.75M | 24.71M | 20.07M |
| Gross Profit | 15.85M | 7.60M | -622.00K |
| Gross Profit Ratio | 29.03% | 23.53% | -3.20% |
| Research & Development | 0.00 | 0.00 | 0.00 |
| General & Administrative | 0.00 | 0.00 | 0.00 |
| Selling & Marketing | 0.00 | 0.00 | 0.00 |
| SG&A | 165.33M | 262.63M | 44.08M |
| Other Expenses | 0.00 | 13.18M | 6.57M |
| Operating Expenses | 165.33M | 275.81M | 50.65M |
| Cost & Expenses | 226.67M | 300.51M | 70.73M |
| Interest Income | 0.00 | 0.00 | 0.00 |
| Interest Expense | 5.54M | 6.40M | 18.27M |
| Depreciation & Amortization | 19.28M | 10.44M | 5.88M |
| EBITDA | -129.82M | -257.76M | -45.39M |
| EBITDA Ratio | -237.76% | -797.75% | -233.37% |
| Operating Income | -149.10M | -268.20M | -51.27M |
| Operating Income Ratio | -273.07% | -830.07% | -263.61% |
| Total Other Income/Expenses | -5.54M | -8.35M | -19.27M |
| Income Before Tax | -154.63M | -276.56M | -70.55M |
| Income Before Tax Ratio | -283.21% | -855.92% | -362.69% |
| Income Tax Expense | 2.00K | 39.00K | 9.00K |
| Net Income | -154.63M | -276.60M | -70.56M |
| Net Income Ratio | -283.21% | -856.04% | -362.73% |
| EPS | -2.29 | -4.10 | -44.78 |
| EPS Diluted | -2.29 | -4.10 | -44.78 |
| Weighted Avg Shares Out | 67.43M | 67.43M | 1.58M |
| Weighted Avg Shares Out (Dil) | 67.43M | 67.43M | 1.58M |

Volta: Stay Away

Volta Stock Plunges on C-Suite Shuffle and Delisting Fears

Volta Launches Program To Make EV Charging More Accessible, Affordable

Low-Priced Electric Vehicle Charging Play Volta Stock Isn't a Bargain

Why EV Stock Volta Plunged by Double Digits Today

Volta Inc. (VLTA) CEO Brandt Hastings on Q1 2022 Results - Earnings Call Transcript

Why Volta Shares Are Trading Higher Today

Why Volta Charged 20% Higher Today

Volta Inc. Reports First Quarter Financial Results

Volta Inc. Announces First Quarter 2022 Earnings Release Date and Conference Call
Source: https://incomestatements.info
Category: Stock Reports
