See more : Zonzia Media, Inc. (ZONX) Income Statement Analysis – Financial Results
Complete financial analysis of Volta Inc. (VLTA) income statement, including revenue, profit margins, EPS and key performance metrics. Get detailed insights into the financial performance of Volta Inc., a leading company in the Specialty Retail industry within the Consumer Cyclical sector.
- Indorama Ventures Public Company Limited (IVL.BK) Income Statement Analysis – Financial Results
- EVRAZ plc (EVRZF) Income Statement Analysis – Financial Results
- GE T&D India Limited (GET&D.NS) Income Statement Analysis – Financial Results
- GQG Partners Inc. (GQG.AX) Income Statement Analysis – Financial Results
- Saudi American Holdings Corp. (SAHN) Income Statement Analysis – Financial Results
Volta Inc. (VLTA)
About Volta Inc.
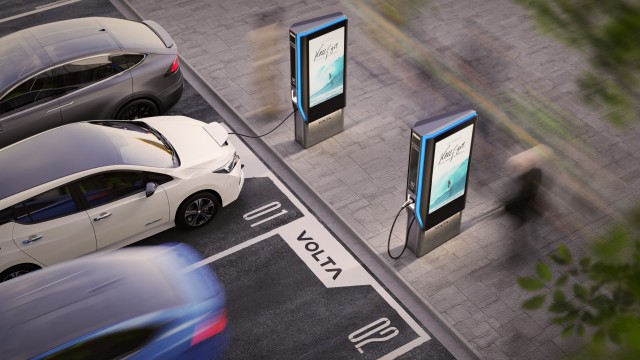
Volta Inc. operates a network of smart media-enabled charging stations for electric vehicles in the United States. As of December 31, 2021, it had installed 2,264 chargers across 23 territories and states. Volta Inc. was founded in 2010 and is headquartered in San Francisco, California.
| Metric | 2022 | 2021 | 2020 |
|---|---|---|---|
| Revenue | 54.60M | 32.31M | 19.45M |
| Cost of Revenue | 38.75M | 24.71M | 20.07M |
| Gross Profit | 15.85M | 7.60M | -622.00K |
| Gross Profit Ratio | 29.03% | 23.53% | -3.20% |
| Research & Development | 0.00 | 0.00 | 0.00 |
| General & Administrative | 0.00 | 0.00 | 0.00 |
| Selling & Marketing | 0.00 | 0.00 | 0.00 |
| SG&A | 165.33M | 262.63M | 44.08M |
| Other Expenses | 0.00 | 13.18M | 6.57M |
| Operating Expenses | 165.33M | 275.81M | 50.65M |
| Cost & Expenses | 226.67M | 300.51M | 70.73M |
| Interest Income | 0.00 | 0.00 | 0.00 |
| Interest Expense | 5.54M | 6.40M | 18.27M |
| Depreciation & Amortization | 19.28M | 10.44M | 5.88M |
| EBITDA | -129.82M | -257.76M | -45.39M |
| EBITDA Ratio | -237.76% | -797.75% | -233.37% |
| Operating Income | -149.10M | -268.20M | -51.27M |
| Operating Income Ratio | -273.07% | -830.07% | -263.61% |
| Total Other Income/Expenses | -5.54M | -8.35M | -19.27M |
| Income Before Tax | -154.63M | -276.56M | -70.55M |
| Income Before Tax Ratio | -283.21% | -855.92% | -362.69% |
| Income Tax Expense | 2.00K | 39.00K | 9.00K |
| Net Income | -154.63M | -276.60M | -70.56M |
| Net Income Ratio | -283.21% | -856.04% | -362.73% |
| EPS | -2.29 | -4.10 | -44.78 |
| EPS Diluted | -2.29 | -4.10 | -44.78 |
| Weighted Avg Shares Out | 67.43M | 67.43M | 1.58M |
| Weighted Avg Shares Out (Dil) | 67.43M | 67.43M | 1.58M |

Shell snaps up EV charging operator Volta for $169 million

5 Penny Stocks Under $1 With High Short Interest This Week

15 EV Stocks to Sell Before They Die

Volta Is In Trouble

4 Cheap Penny Stocks To Buy For Under $1 Right Now

Volta, Inc. (VLTA) Q3 2022 Earnings Call Transcript

Volta Inc. (VLTA) Reports Q3 Loss, Misses Revenue Estimates

Volta Inc. Announces Third Quarter 2022 Earnings Release Date and Conference Call

7 EV Stocks to Buy During a Stock Market Crash

Why Shares of Volta Are Plummeting This Week
Source: https://incomestatements.info
Category: Stock Reports
