See more : Worsley Investors Limited (WINV.L) Income Statement Analysis – Financial Results
Complete financial analysis of Venture Minerals Limited (VTMLF) income statement, including revenue, profit margins, EPS and key performance metrics. Get detailed insights into the financial performance of Venture Minerals Limited, a leading company in the Industrial Materials industry within the Basic Materials sector.
- ESG Global Impact Capital Inc. (ESIFF) Income Statement Analysis – Financial Results
- Group Nine Acquisition Corp. (GNACU) Income Statement Analysis – Financial Results
- Pacific Net Co.,Ltd. (3021.T) Income Statement Analysis – Financial Results
- China Eastern Airlines Corporation Limited (600115.SS) Income Statement Analysis – Financial Results
- Arcadis NV (ARCVF) Income Statement Analysis – Financial Results
Venture Minerals Limited (VTMLF)
About Venture Minerals Limited
Venture Minerals Limited engages in the mineral exploration and development business in Australia. The company explores for nickel, iron, cobalt, tin, tungsten, copper, silver, gold, lead, zinc, and PGE deposits. Its flagship project is the 100% owned Mount Lindsay project that covers an area of approximately 159 square kilometers located in north-western Tasmania. Venture Minerals Limited was incorporated in 2006 and is based in West Perth, Australia.
| Metric | 2023 | 2022 | 2021 | 2020 | 2019 | 2018 | 2017 | 2016 | 2015 | 2014 | 2013 | 2012 | 2011 | 2010 | 2009 | 2008 | 2007 |
|---|---|---|---|---|---|---|---|---|---|---|---|---|---|---|---|---|---|
| Revenue | 94.93K | 8.09K | 6.22K | 14.49K | 23.84K | 35.35K | 220.69K | 150.23K | 174.73K | 327.49K | 679.95K | 0.00 | 0.00 | 0.00 | 0.00 | 0.00 | 0.00 |
| Cost of Revenue | 0.00 | 81.31K | 27.32K | 14.71K | 16.78K | 30.09K | 75.57K | 44.63K | 0.00 | 0.00 | 0.00 | 0.00 | 0.00 | 0.00 | 0.00 | 0.00 | 0.00 |
| Gross Profit | 94.93K | -73.22K | -21.10K | -216.00 | 7.05K | 5.26K | 145.13K | 105.60K | 174.73K | 327.49K | 679.95K | 0.00 | 0.00 | 0.00 | 0.00 | 0.00 | 0.00 |
| Gross Profit Ratio | 100.00% | -905.01% | -339.18% | -1.49% | 29.59% | 14.89% | 65.76% | 70.29% | 100.00% | 100.00% | 100.00% | 0.00% | 0.00% | 0.00% | 0.00% | 0.00% | 0.00% |
| Research & Development | 0.00 | 0.00 | 0.00 | 0.00 | 0.00 | 0.00 | 0.00 | 0.00 | 0.00 | 0.00 | 0.00 | 0.00 | 0.00 | 0.00 | 0.00 | 0.00 | 0.00 |
| General & Administrative | 1.75M | 1.56M | 856.33K | 446.16K | 1.01M | 799.53K | 478.49K | 1.15M | 1.34M | 2.15M | 3.32M | 3.85M | 4.27M | 2.27M | 1.74M | 1.95M | 843.03K |
| Selling & Marketing | 6.88M | 5.07M | 1.52M | 696.64K | 2.33M | 2.21M | 119.95K | 153.42K | 390.49K | 657.57K | 852.88K | 707.27K | 501.92K | 268.49K | 237.78K | 82.60K | 91.87K |
| SG&A | 8.48M | 6.62M | 2.38M | 1.14M | 1.28M | 1.06M | 703.16K | 1.40M | 1.34M | 2.15M | 3.32M | 3.85M | 4.27M | 2.27M | 1.74M | 1.95M | 843.03K |
| Other Expenses | 24.56K | 5.07K | 51.44K | 50.00K | 35.82K | 4.78K | 176.30K | 254.60K | 0.00 | 0.00 | 1.16M | 1.01M | 853.78K | 394.35K | 1.60K | 6.30K | 199.02K |
| Operating Expenses | 9.20M | 6.62M | 2.38M | 1.14M | 1.28M | 1.06M | 703.16K | 1.40M | 3.50M | 5.80M | 5.34M | 5.56M | 5.63M | 2.94M | 3.74M | 2.19M | 1.13M |
| Cost & Expenses | 9.20M | 6.71M | 2.41M | 1.16M | 1.30M | 1.09M | 778.73K | 1.45M | 2.70M | 7.48M | 5.34M | 5.56M | 5.63M | 2.94M | 3.74M | 2.19M | 1.13M |
| Interest Income | 94.93K | 8.09K | 6.22K | 14.49K | 23.84K | 30.57K | 44.39K | 93.61K | 174.73K | 327.49K | 679.95K | 751.43K | 1.07M | 305.97K | 105.37K | 163.11K | 120.45K |
| Interest Expense | 27.18K | 34.14K | 25.91K | 25.01K | 13.35K | 14.15K | 17.56K | 27.26K | 1.82K | 5.03K | 227.82K | 11.89K | 8.92K | 0.00 | 0.00 | 5.02K | 3.13K |
| Depreciation & Amortization | 75.82K | 81.31K | 27.32K | 14.71K | 16.78K | 30.09K | 75.57K | 44.63K | 65.15K | 55.60K | 39.37K | 46.85K | 49.73K | 19.85K | 20.74K | 15.99K | 2.27K |
| EBITDA | -9.01M | -6.62M | -2.38M | -1.14M | -1.28M | -1.06M | -703.16K | -1.40M | -3.43M | -5.67M | -4.62M | -4.76M | -4.50M | -2.92M | -3.71M | -2.00M | -1.01M |
| EBITDA Ratio | -9,489.91% | -81,886.53% | -38,283.28% | -7,886.75% | -5,367.22% | -2,985.71% | -318.61% | -934.29% | -1,963.85% | -1,731.30% | -679.33% | 0.00% | 0.00% | 0.00% | 0.00% | 0.00% | 0.00% |
| Operating Income | -8.98M | -6.71M | -2.41M | -1.16M | -1.30M | -1.09M | -778.73K | -1.45M | -2.42M | -6.98M | -5.34M | -5.56M | -5.63M | -2.94M | -3.74M | -2.19M | -1.13M |
| Operating Income Ratio | -9,456.12% | -82,891.59% | -38,722.51% | -7,988.27% | -5,437.62% | -3,070.84% | -352.86% | -964.00% | -1,386.77% | -2,132.23% | -785.12% | 0.00% | 0.00% | 0.00% | 0.00% | 0.00% | 0.00% |
| Total Other Income/Expenses | -135.08K | -4.73M | -148.37K | -62.18K | 98.28K | -894.03K | -81.31K | -885.12K | -897.94K | -164.61K | -451.01K | -45.95K | 384.72K | 305.97K | -1.57M | 164.38K | -15.29K |
| Income Before Tax | -9.11M | -17.76M | -11.75M | -2.20M | -2.84M | -3.51M | -1.78M | -3.52M | -3.32M | -5.54M | -4.89M | -4.82M | -4.56M | -2.63M | -3.63M | -2.02M | -1.02M |
| Income Before Tax Ratio | -9,598.41% | -219,496.16% | -188,908.02% | -15,214.35% | -11,897.00% | -9,932.86% | -807.89% | -2,341.78% | -1,900.69% | -1,692.09% | -718.63% | 0.00% | 0.00% | 0.00% | 0.00% | 0.00% | 0.00% |
| Income Tax Expense | 0.00 | 5.00 | 3.00 | 4.00 | 147.25K | 5.00 | 3.00 | -197.98K | -793.92K | -1.42M | -1.71M | -867.26K | -431.78K | -331.41K | -244.57K | 11.32K | -88.74K |
| Net Income | -9.11M | -17.76M | -11.75M | -2.20M | -2.98M | -3.51M | -1.78M | -3.32M | -2.53M | -4.12M | -3.17M | -3.96M | -4.13M | -2.30M | -3.38M | -2.02M | -1.02M |
| Net Income Ratio | -9,598.41% | -219,496.16% | -188,908.02% | -15,214.35% | -12,514.78% | -9,932.86% | -807.89% | -2,209.99% | -1,446.30% | -1,259.44% | -466.82% | 0.00% | 0.00% | 0.00% | 0.00% | 0.00% | 0.00% |
| EPS | -0.01 | -0.01 | -0.01 | 0.00 | -0.01 | -0.01 | -0.01 | -0.01 | -0.01 | -0.01 | -0.01 | -0.02 | -0.02 | -0.01 | -0.04 | -0.04 | -0.02 |
| EPS Diluted | -0.01 | -0.01 | -0.01 | 0.00 | -0.01 | -0.01 | -0.01 | -0.01 | -0.01 | -0.01 | -0.01 | -0.02 | -0.02 | -0.01 | -0.04 | -0.04 | -0.02 |
| Weighted Avg Shares Out | 1.75B | 1.51B | 1.10B | 807.31M | 529.92M | 421.46M | 335.89M | 318.06M | 301.69M | 301.69M | 276.61M | 237.45M | 212.89M | 154.20M | 90.02M | 57.07M | 42.47M |
| Weighted Avg Shares Out (Dil) | 1.75B | 1.51B | 1.10B | 807.31M | 529.92M | 421.46M | 335.89M | 318.06M | 301.69M | 301.69M | 290.44M | 237.45M | 212.89M | 154.20M | 90.02M | 57.07M | 42.47M |

Venture Minerals appoints Philippa Leggat as managing director on resignation of Andrew Radonjic
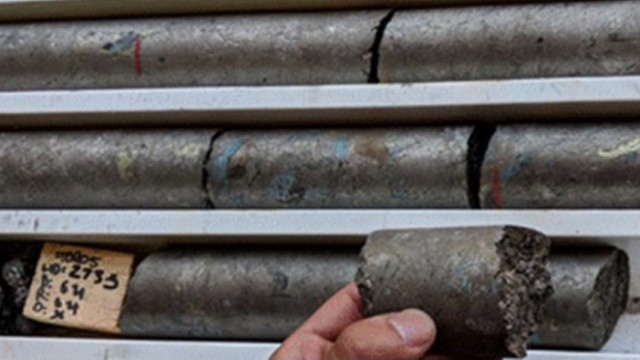
Venture Minerals fields new targets in survey by partner Chalice on ‘Julimar lookalike' nickel-copper-PGE play

Venture Minerals readies A$6 million war chest for Mount Lindsay tin-tungsten play in heavily oversubscribed SPP
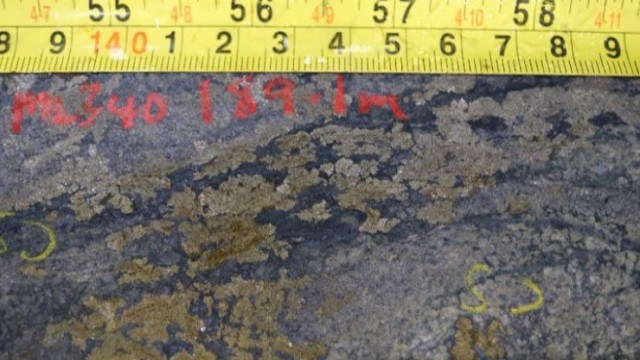
Venture Minerals surges on returning record-breaking Mt Lindsay hit of 147 metres at 1% tin
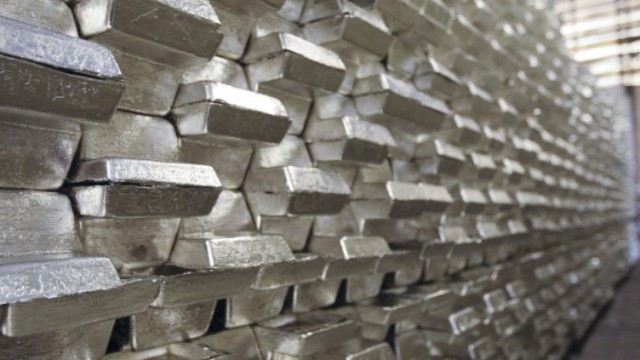
Venture Minerals out to raise A$5.5 million for exploration drilling at Mount Lindsay
Venture Minerals JV partner Chalice Mining completes Phase 1 exploration at 'Julimar lookalike'

Venture Minerals returns 93-metre zone of tin-tungsten mineralisation at Mount Lindsay

Venture Minerals enters an exciting phase as it moves from explorer to producer at Riley Iron Ore Mine
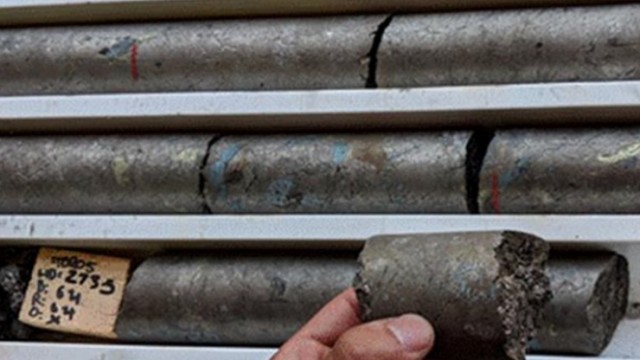
Venture Minerals partner Chalice Mining resurrects EM survey over “Julimar lookalike”
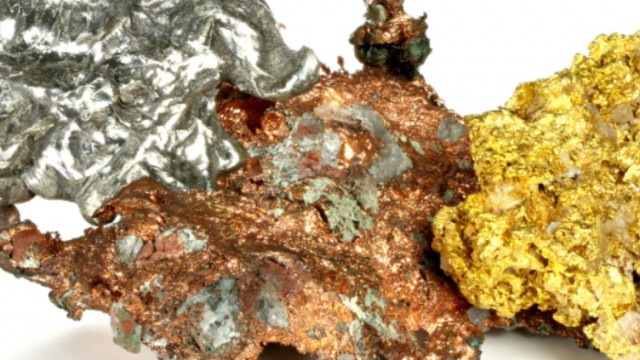
Venture Minerals enhances Golden Grove North Zinc-Copper-Gold Project with potential 5-kilometre-long VMS conductor and multiple other targets
Source: https://incomestatements.info
Category: Stock Reports
