See more : HORIBA, Ltd. (6856.T) Income Statement Analysis – Financial Results
Complete financial analysis of Tharisa plc (TIHRF) income statement, including revenue, profit margins, EPS and key performance metrics. Get detailed insights into the financial performance of Tharisa plc, a leading company in the Other Precious Metals industry within the Basic Materials sector.
- Shenzhen KTC Technology Co., Ltd. (001308.SZ) Income Statement Analysis – Financial Results
- Yellow Corporation (YELLQ) Income Statement Analysis – Financial Results
- ScreenPro Security Inc. (SCRSF) Income Statement Analysis – Financial Results
- Tishman Speyer Innovation Corp. II (TSIBU) Income Statement Analysis – Financial Results
- Western Energy Services Corp. (WRG.TO) Income Statement Analysis – Financial Results
Tharisa plc (TIHRF)
About Tharisa plc
Tharisa plc, an investment holding company, engages in the mining, processing, beneficiation, marketing, sale, and logistics of platinum group metals (PGM) and chrome concentrates in South Africa, China, Singapore, Hong Kong, Australia, Japan, and internationally. It operates through four segments: PGM, Chrome, Agency and Trading, and Manufacturing. The company's PGM basket includes platinum, palladium, rhodium, gold, ruthenium, iridium, nickel, and copper. It holds 100% interest in the Tharisa mine, an open pit PGM and chrome mine located on the south-western limb of the Bushveld Complex, South Africa. The company also offers chemical and foundry grade chrome concentrates; and metallurgical grade chrome concentrate for stainless steel and ferrochrome producers, as well as commodity traders. In addition, it is involved the manufacturing of mining equipment. The company was incorporated in 2008 and is based in Paphos, Cyprus.
| Metric | 2024 | 2023 | 2022 | 2021 | 2020 | 2019 | 2018 | 2017 | 2016 | 2015 | 2014 | 2013 | 2012 |
|---|---|---|---|---|---|---|---|---|---|---|---|---|---|
| Revenue | 721.39M | 621.52M | 596.29M | 586.43M | 395.20M | 324.33M | 375.76M | 346.14M | 235.86M | 246.78M | 240.73M | 215.46M | 53.89M |
| Cost of Revenue | 536.79M | 475.07M | 385.04M | 380.10M | 267.14M | 265.11M | 273.53M | 225.58M | 178.06M | 203.69M | 208.12M | 189.57M | 62.11M |
| Gross Profit | 184.61M | 146.45M | 211.25M | 206.33M | 128.06M | 59.22M | 102.22M | 120.56M | 57.79M | 43.09M | 32.61M | 25.89M | -8.23M |
| Gross Profit Ratio | 25.59% | 23.56% | 35.43% | 35.18% | 32.40% | 18.26% | 27.20% | 34.83% | 24.50% | 17.46% | 13.55% | 12.01% | -15.26% |
| Research & Development | 1.03M | 1.25M | 601.51K | 594.94K | 178.13K | 332.00K | 235.00K | 0.00 | 0.00 | 0.00 | 0.00 | 0.00 | 0.00 |
| General & Administrative | 19.55M | 16.96M | 13.82M | 12.62M | 9.63M | 11.87M | 11.41M | 8.49M | 7.79M | 8.35M | 11.06M | 26.60M | 25.96M |
| Selling & Marketing | 0.00 | 33.40M | 333.00K | 94.00K | 304.00K | 702.00K | 410.00K | 358.00K | 285.00K | 580.00K | 767.00K | 0.00 | 0.00 |
| SG&A | 19.55M | 50.36M | 41.52M | 41.36M | 33.22M | 33.93M | 34.79M | 25.55M | 22.41M | 8.93M | 11.83M | 26.60M | 25.96M |
| Other Expenses | 44.48M | 0.00 | -735.00K | -346.00K | 7.00K | 7.00K | 14.00K | 0.00 | 0.00 | 0.00 | 0.00 | 0.00 | 0.00 |
| Operating Expenses | 65.05M | 51.32M | 42.12M | 41.95M | 33.40M | 34.26M | 34.79M | 25.55M | 22.41M | 24.73M | 26.76M | 26.55M | 25.29M |
| Cost & Expenses | 601.84M | 526.38M | 427.16M | 422.05M | 300.54M | 299.37M | 308.33M | 251.14M | 200.47M | 228.42M | 234.88M | 216.12M | 87.41M |
| Interest Income | 8.60M | 1.14M | 1.20M | 1.37M | 918.90K | 1.36M | 1.28M | 1.12M | 770.00K | 1.19M | 897.00K | 863.00K | 2.13M |
| Interest Expense | 11.88M | 7.10M | 3.30M | 4.09M | 5.67M | 7.26M | 10.19M | 7.69M | 11.82M | 11.86M | 14.00M | 14.74M | 1.60M |
| Depreciation & Amortization | 54.73M | 39.24M | 35.24M | 36.94M | 28.28M | 26.84M | 28.30M | 17.26M | 11.27M | 10.26M | 10.76M | 12.44M | 5.16M |
| EBITDA | 184.28M | 154.37M | 204.37M | 201.32M | 108.28M | 46.21M | 97.20M | 112.26M | 45.64M | 29.80M | -15.04M | -33.39M | -31.78M |
| EBITDA Ratio | 25.55% | 24.84% | 34.27% | 34.33% | 31.11% | 15.97% | 25.48% | 32.43% | 19.78% | 12.07% | -6.19% | -16.61% | -59.18% |
| Operating Income | 119.56M | 94.69M | 169.13M | 164.38M | 94.66M | 24.96M | 67.43M | 95.00M | 35.39M | 18.36M | 5.85M | -663.00K | -33.52M |
| Operating Income Ratio | 16.57% | 15.24% | 28.36% | 28.03% | 23.95% | 7.70% | 17.95% | 27.45% | 15.00% | 7.44% | 2.43% | -0.31% | -62.20% |
| Total Other Income/Expenses | -1.88M | 19.65M | 11.42M | 3.58M | -11.89M | -12.10M | -8.47M | -7.38M | -10.27M | -8.72M | -46.18M | -62.31M | -5.13M |
| Income Before Tax | 117.68M | 114.34M | 195.97M | 182.42M | 74.34M | 12.11M | 60.16M | 90.13M | 23.59M | 9.63M | -40.33M | -62.97M | -38.65M |
| Income Before Tax Ratio | 16.31% | 18.40% | 32.86% | 31.11% | 18.81% | 3.74% | 16.01% | 26.04% | 10.00% | 3.90% | -16.75% | -29.23% | -71.72% |
| Income Tax Expense | 35.04M | 27.56M | 46.13M | 52.82M | 20.25M | 2.63M | 12.96M | 23.10M | 6.63M | 3.62M | 14.55M | -15.53M | -8.68M |
| Net Income | 82.90M | 82.24M | 153.88M | 100.47M | 43.30M | 10.62M | 48.43M | 57.60M | 13.81M | 4.62M | -49.00M | -38.93M | -20.95M |
| Net Income Ratio | 11.49% | 13.23% | 25.81% | 17.13% | 10.96% | 3.27% | 12.89% | 16.64% | 5.85% | 1.87% | -20.35% | -18.07% | -38.88% |
| EPS | 0.28 | 0.27 | 0.47 | 0.37 | 0.16 | 0.04 | 0.19 | 0.22 | 0.05 | 0.02 | -0.20 | -0.16 | -0.09 |
| EPS Diluted | 0.27 | 0.27 | 0.47 | 0.37 | 0.16 | 0.04 | 0.18 | 0.22 | 0.05 | 0.02 | -0.20 | -0.16 | -0.09 |
| Weighted Avg Shares Out | 299.07M | 299.82M | 285.78M | 268.86M | 266.61M | 263.13M | 260.33M | 257.39M | 256.18M | 255.08M | 247.88M | 241.59M | 241.59M |
| Weighted Avg Shares Out (Dil) | 307.49M | 302.71M | 285.90M | 269.46M | 267.36M | 264.88M | 264.53M | 257.39M | 256.18M | 255.08M | 247.88M | 241.59M | 241.59M |
Tharisa delivers solid prelims; making progress on all fronts
Tharisa makes significant financial and operational headway
Tharisa's cash generation catches the eye
Tharisa hits chrome production record after 'scene-setting' year
Tharisa secures long-term supply of renewable power
Tharisa broker upbeat on miner's prospects after Q3 update
Tharisa delivers "operationally as planned" after solid quarter
Tharisa helped by chrome arm as platinum prices slip

Tharisa helped by chrome arm as platinum prices slip
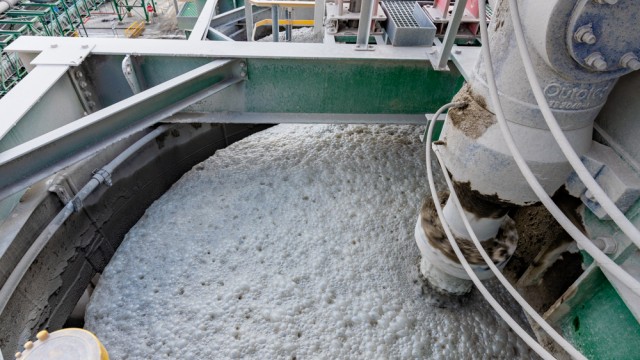
Tharisa earnings hit by weak platinum prices and higher costs
Source: https://incomestatements.info
Category: Stock Reports
