See more : Heart Test Laboratories, Inc. (HSCS) Income Statement Analysis – Financial Results
Complete financial analysis of Mercedes-Benz Group AG (DMLRY) income statement, including revenue, profit margins, EPS and key performance metrics. Get detailed insights into the financial performance of Mercedes-Benz Group AG, a leading company in the Auto – Manufacturers industry within the Consumer Cyclical sector.
- Simplo Technology Co., Ltd. (6121.TWO) Income Statement Analysis – Financial Results
- Townsquare Media, Inc. (TSQ) Income Statement Analysis – Financial Results
- UniDevice AG (UDC.DE) Income Statement Analysis – Financial Results
- Affinity Networks, Inc. (AFFN) Income Statement Analysis – Financial Results
- Cogia AG (8HC.DU) Income Statement Analysis – Financial Results
Mercedes-Benz Group AG (DMLRY)
About Mercedes-Benz Group AG
Mercedes-Benz Group AG operates as an automotive company in Germany and internationally. The company develops, manufactures, and sells passenger cars comprising premium and luxury vehicles of the Mercedes-Benz brand, including the Mercedes-AMG, G-Class, Mercedes-Maybach, and Mercedes-EQ brands, as well as small cars under the smart brand; ecosystem of Mercedes-Benz under the Mercedes me brand; and vans under the Mercedes-Benz and Freightliner brands, as well as related spare parts and accessories. It also provides financing and leasing packages for end-customers and dealers; automotive insurance brokerage and banking services; car subscription and car rental, and fleet management, as well as digital services for charging and payment; and mobility services. The company was formerly known as Daimler AG and changed its name to Mercedes-Benz Group AG in February 2022. Mercedes-Benz Group AG was founded in 1886 and is headquartered in Stuttgart, Germany.
| Metric | 2021 | 2020 | 2019 | 2018 | 2017 | 2016 | 2015 | 2014 | 2013 | 2012 | 2011 | 2010 | 2009 | 2008 | 2007 | 2006 | 2005 | 2004 | 2003 | 2002 | 2001 | 2000 | 1999 | 1998 |
|---|---|---|---|---|---|---|---|---|---|---|---|---|---|---|---|---|---|---|---|---|---|---|---|---|
| Revenue | 133.89B | 154.31B | 172.75B | 167.36B | 164.33B | 153.26B | 149.47B | 129.87B | 117.98B | 114.30B | 106.54B | 97.76B | 78.92B | 96.10B | 99.56B | 151.59B | 149.66B | 141.95B | 136.20B | 149.72B | 153.14B | 162.32B | 150.10B | 131.83B |
| Cost of Revenue | 103.22B | 128.72B | 143.58B | 134.30B | 130.00B | 121.30B | 117.67B | 101.69B | 92.46B | 88.78B | 81.02B | 74.99B | 65.57B | 74.49B | 75.52B | 125.67B | 122.80B | 114.48B | 109.73B | 121.57B | 128.62B | 121.14B | 108.95B | 96.43B |
| Gross Profit | 30.68B | 25.59B | 29.17B | 33.07B | 34.33B | 31.96B | 31.80B | 28.18B | 25.53B | 25.51B | 25.52B | 22.77B | 13.36B | 21.61B | 24.03B | 25.92B | 26.86B | 27.47B | 26.47B | 28.15B | 24.52B | 41.18B | 41.15B | 35.41B |
| Gross Profit Ratio | 22.91% | 16.58% | 16.88% | 19.76% | 20.89% | 20.86% | 21.27% | 21.70% | 21.63% | 22.32% | 23.95% | 23.29% | 16.92% | 22.49% | 24.14% | 17.10% | 17.95% | 19.35% | 19.43% | 18.80% | 16.01% | 25.37% | 27.41% | 26.86% |
| Research & Development | 5.47B | 6.12B | 6.59B | 6.58B | 5.94B | 5.26B | 4.76B | 4.53B | 4.10B | 4.18B | 4.17B | 3.48B | 2.90B | 3.06B | 3.16B | 5.33B | 5.65B | 5.65B | 5.56B | 6.08B | 5.94B | 6.33B | 5.74B | 4.97B |
| General & Administrative | 2.81B | 3.53B | 4.05B | 4.04B | 3.81B | 3.42B | 3.71B | 3.33B | 3.87B | 3.97B | 3.86B | 4.06B | 3.29B | 13.36B | 13.00B | 18.51B | 18.97B | 17.96B | 17.74B | 18.31B | 18.36B | 17.86B | 17.55B | 16.24B |
| Selling & Marketing | 9.19B | 11.06B | 12.80B | 13.07B | 12.97B | 12.23B | 12.15B | 11.53B | 10.88B | 10.45B | 9.82B | 8.86B | 7.61B | 0.00 | 0.00 | 0.00 | 0.00 | 0.00 | 0.00 | 0.00 | 0.00 | 0.00 | 0.00 | 0.00 |
| SG&A | 12.00B | 14.59B | 16.85B | 17.10B | 16.77B | 15.65B | 15.86B | 14.86B | 14.74B | 14.42B | 13.68B | 12.92B | 10.90B | 13.36B | 13.00B | 18.51B | 18.97B | 17.96B | 17.74B | 18.31B | 18.36B | 17.86B | 17.55B | 16.24B |
| Other Expenses | -1.77B | -1.27B | 2.42B | -675.00M | -1.37B | -1.01B | -1.36B | -690.00M | -1.13B | -1.12B | -1.03B | -750.00M | -262.00M | 0.00 | 0.00 | 0.00 | 0.00 | 0.00 | 0.00 | 0.00 | 0.00 | 13.61B | 9.36B | 7.33B |
| Operating Expenses | 15.70B | 19.44B | 25.86B | 23.01B | 21.35B | 19.89B | 19.25B | 18.71B | 17.71B | 17.49B | 16.83B | 15.65B | 13.53B | 16.42B | 16.16B | 23.84B | 24.62B | 23.61B | 23.30B | 24.39B | 24.31B | 37.80B | 32.64B | 28.54B |
| Cost & Expenses | 118.92B | 148.16B | 169.44B | 157.30B | 151.35B | 141.19B | 136.92B | 120.39B | 110.17B | 106.27B | 97.85B | 90.64B | 79.10B | 90.91B | 91.69B | 149.52B | 147.42B | 138.09B | 133.04B | 145.95B | 152.92B | 158.94B | 141.59B | 124.97B |
| Interest Income | 212.00M | 220.00M | 397.00M | 271.00M | 214.00M | 230.00M | 170.00M | 145.00M | 212.00M | 828.00M | 285.00M | 825.00M | 0.00 | 0.00 | 0.00 | 0.00 | 0.00 | 0.00 | 0.00 | 0.00 | 0.00 | 0.00 | 0.00 | 0.00 |
| Interest Expense | 429.00M | 484.00M | 880.00M | 793.00M | 582.00M | 546.00M | 602.00M | 715.00M | 884.00M | 1.73B | 232.00M | 1.47B | -2.13B | 0.00 | 0.00 | 0.00 | 0.00 | 0.00 | 0.00 | 0.00 | 0.00 | 0.00 | 0.00 | 0.00 |
| Depreciation & Amortization | 6.98B | 8.96B | 7.75B | 6.31B | 5.68B | 5.48B | 5.38B | 5.00B | 4.37B | 4.07B | 3.58B | 3.36B | 3.26B | 5.64B | 8.02B | 13.67B | 12.64B | 11.25B | 11.40B | 13.64B | 14.30B | 13.61B | 9.36B | 7.33B |
| EBITDA | 35.18B | 15.40B | 12.13B | 17.36B | 20.22B | 18.34B | 18.44B | 15.56B | 13.51B | 13.11B | 11.89B | 11.29B | -1.16B | 8.15B | 16.34B | 17.61B | 16.00B | 14.89B | 12.82B | 19.53B | 12.86B | 23.50B | 19.64B | 15.23B |
| EBITDA Ratio | 26.27% | 9.98% | 7.02% | 10.37% | 12.30% | 11.97% | 12.34% | 11.98% | 11.45% | 11.47% | 11.16% | 11.55% | -1.46% | 8.48% | 16.41% | 11.62% | 10.69% | 10.49% | 9.41% | 13.05% | 8.40% | 14.48% | 13.09% | 11.55% |
| Operating Income | 28.20B | 6.15B | 3.31B | 10.06B | 12.98B | 12.07B | 12.54B | 9.48B | 7.81B | 8.62B | 8.76B | 7.27B | -172.00M | 5.23B | 7.88B | 2.07B | 2.25B | 3.86B | 3.16B | 3.77B | 215.79M | 3.37B | 8.50B | 6.86B |
| Operating Income Ratio | 21.06% | 3.99% | 1.92% | 6.01% | 7.90% | 7.88% | 8.39% | 7.30% | 6.62% | 7.54% | 8.22% | 7.44% | -0.22% | 5.44% | 7.91% | 1.37% | 1.50% | 2.72% | 2.32% | 2.52% | 0.14% | 2.08% | 5.67% | 5.21% |
| Total Other Income/Expenses | -12.39B | 189.00M | 520.00M | 537.00M | 1.32B | 500.00M | 201.00M | 694.00M | 2.33B | -897.00M | -306.00M | -646.00M | -2.13B | -2.42B | 1.32B | 1.92B | 1.19B | -326.79M | -2.60B | 2.29B | -1.66B | 1.09B | 1.14B | 1.16B |
| Income Before Tax | 15.81B | 6.34B | 3.83B | 10.60B | 14.30B | 12.57B | 12.74B | 10.17B | 10.14B | 7.72B | 8.45B | 6.63B | -2.30B | 2.80B | 9.20B | 3.99B | 3.44B | 3.53B | 559.79M | 6.06B | -1.44B | 4.46B | 9.65B | 8.03B |
| Income Before Tax Ratio | 11.81% | 4.11% | 2.22% | 6.33% | 8.70% | 8.20% | 8.53% | 7.83% | 8.59% | 6.75% | 7.93% | 6.78% | -2.91% | 2.92% | 9.24% | 2.63% | 2.30% | 2.49% | 0.41% | 4.05% | -0.94% | 2.75% | 6.43% | 6.09% |
| Income Tax Expense | 4.76B | 2.33B | 1.12B | 3.01B | 3.44B | 3.79B | 4.03B | 2.88B | 1.42B | 1.22B | 2.42B | 1.95B | 346.00M | 1.09B | 4.33B | 706.17M | 512.50M | 1.18B | 977.45M | 1.18B | -778.87M | 2.00B | 4.54B | 3.08B |
| Net Income | 11.05B | 3.63B | 2.38B | 7.25B | 10.53B | 8.53B | 8.42B | 6.96B | 6.84B | 6.10B | 5.67B | 4.50B | -2.64B | 1.42B | 3.99B | 3.23B | 2.84B | 2.46B | 446.24M | 4.72B | -663.11M | 7.89B | 5.75B | 4.82B |
| Net Income Ratio | 8.25% | 2.35% | 1.38% | 4.33% | 6.40% | 5.56% | 5.64% | 5.36% | 5.80% | 5.33% | 5.32% | 4.60% | -3.34% | 1.47% | 4.00% | 2.13% | 1.90% | 1.74% | 0.33% | 3.15% | -0.43% | 4.86% | 3.83% | 3.66% |
| EPS | 2.58 | 0.85 | 0.56 | 1.69 | 2.46 | 1.99 | 1.97 | 1.63 | 1.60 | 1.43 | 1.33 | 1.07 | -0.66 | 0.37 | 0.96 | 0.79 | 0.70 | 0.61 | 0.11 | 1.17 | -0.17 | 1.97 | 1.43 | 1.26 |
| EPS Diluted | 2.58 | 0.85 | 0.56 | 1.69 | 2.46 | 1.99 | 1.97 | 1.63 | 1.60 | 1.43 | 1.33 | 1.07 | -0.66 | 0.37 | 0.95 | 0.78 | 0.70 | 0.61 | 0.11 | 1.16 | -0.17 | 1.95 | 1.42 | 1.22 |
| Weighted Avg Shares Out | 4.28B | 4.28B | 4.28B | 4.28B | 4.28B | 4.28B | 4.28B | 4.28B | 4.28B | 4.27B | 4.26B | 4.20B | 4.02B | 3.83B | 4.15B | 4.09B | 4.08B | 4.04B | 4.05B | 4.03B | 4.01B | 4.01B | 4.01B | 3.84B |
| Weighted Avg Shares Out (Dil) | 4.28B | 4.28B | 4.28B | 4.28B | 4.28B | 4.28B | 4.28B | 4.28B | 4.28B | 4.27B | 4.27B | 4.21B | 4.02B | 3.84B | 4.18B | 4.11B | 4.08B | 4.04B | 4.05B | 4.06B | 4.01B | 4.06B | 4.05B | 3.95B |

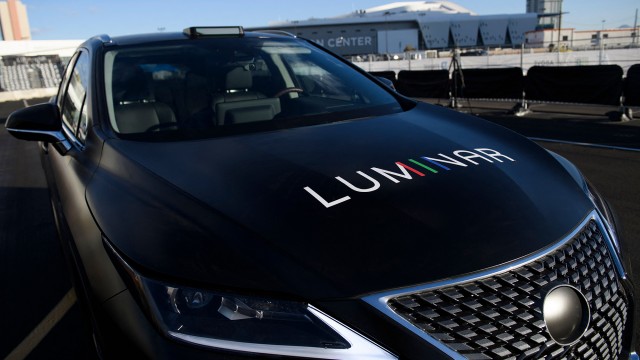
Luminar stock surges 23% on Mercedes self-driving deal

Luminar Stock Is Soaring on a New Deal With Mercedes-Benz

LAZR Stock: The Mercedes-Benz Deal That Has Luminar Technologies Lighting Up Today

Mercedes' future vehicles will have Luminar lidar under new deal

Why Luminar Technologies Shares Are Ripping Higher Today

Shares of autonomous driving tech company Luminar surge on Mercedes-Benz deal

Luminar to Enable Enhanced Safety and Autonomy on Mercedes-Benz Passenger Cars

Daimler - Catching Up, And Valuation Is Looking Better After Spinoff

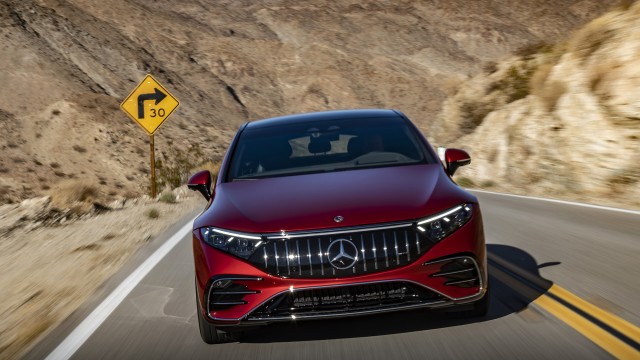
Here's what happened when Mercedes-AMG got its hands on the all-electric EQS

Daimler's Mercedes-Benz sees 5% sales drop in 2021
Source: https://incomestatements.info
Category: Stock Reports
