See more : Powerlong Real Estate Holdings Limited (1238.HK) Income Statement Analysis – Financial Results
Complete financial analysis of Mercedes-Benz Group AG (DMLRY) income statement, including revenue, profit margins, EPS and key performance metrics. Get detailed insights into the financial performance of Mercedes-Benz Group AG, a leading company in the Auto – Manufacturers industry within the Consumer Cyclical sector.
- Infinite Finance Co., Ltd. (6958.TWO) Income Statement Analysis – Financial Results
- Kalamazoo Resources Limited (KAMRF) Income Statement Analysis – Financial Results
- Investeringsforeningen Danske Invest – USA – Akkumulerende KL (DKIUSAIAKKDKKH.CO) Income Statement Analysis – Financial Results
- Ribomic Inc. (4591.T) Income Statement Analysis – Financial Results
- Moringa Acquisition Corp (MACA) Income Statement Analysis – Financial Results
Mercedes-Benz Group AG (DMLRY)
About Mercedes-Benz Group AG
Mercedes-Benz Group AG operates as an automotive company in Germany and internationally. The company develops, manufactures, and sells passenger cars comprising premium and luxury vehicles of the Mercedes-Benz brand, including the Mercedes-AMG, G-Class, Mercedes-Maybach, and Mercedes-EQ brands, as well as small cars under the smart brand; ecosystem of Mercedes-Benz under the Mercedes me brand; and vans under the Mercedes-Benz and Freightliner brands, as well as related spare parts and accessories. It also provides financing and leasing packages for end-customers and dealers; automotive insurance brokerage and banking services; car subscription and car rental, and fleet management, as well as digital services for charging and payment; and mobility services. The company was formerly known as Daimler AG and changed its name to Mercedes-Benz Group AG in February 2022. Mercedes-Benz Group AG was founded in 1886 and is headquartered in Stuttgart, Germany.
| Metric | 2021 | 2020 | 2019 | 2018 | 2017 | 2016 | 2015 | 2014 | 2013 | 2012 | 2011 | 2010 | 2009 | 2008 | 2007 | 2006 | 2005 | 2004 | 2003 | 2002 | 2001 | 2000 | 1999 | 1998 |
|---|---|---|---|---|---|---|---|---|---|---|---|---|---|---|---|---|---|---|---|---|---|---|---|---|
| Revenue | 133.89B | 154.31B | 172.75B | 167.36B | 164.33B | 153.26B | 149.47B | 129.87B | 117.98B | 114.30B | 106.54B | 97.76B | 78.92B | 96.10B | 99.56B | 151.59B | 149.66B | 141.95B | 136.20B | 149.72B | 153.14B | 162.32B | 150.10B | 131.83B |
| Cost of Revenue | 103.22B | 128.72B | 143.58B | 134.30B | 130.00B | 121.30B | 117.67B | 101.69B | 92.46B | 88.78B | 81.02B | 74.99B | 65.57B | 74.49B | 75.52B | 125.67B | 122.80B | 114.48B | 109.73B | 121.57B | 128.62B | 121.14B | 108.95B | 96.43B |
| Gross Profit | 30.68B | 25.59B | 29.17B | 33.07B | 34.33B | 31.96B | 31.80B | 28.18B | 25.53B | 25.51B | 25.52B | 22.77B | 13.36B | 21.61B | 24.03B | 25.92B | 26.86B | 27.47B | 26.47B | 28.15B | 24.52B | 41.18B | 41.15B | 35.41B |
| Gross Profit Ratio | 22.91% | 16.58% | 16.88% | 19.76% | 20.89% | 20.86% | 21.27% | 21.70% | 21.63% | 22.32% | 23.95% | 23.29% | 16.92% | 22.49% | 24.14% | 17.10% | 17.95% | 19.35% | 19.43% | 18.80% | 16.01% | 25.37% | 27.41% | 26.86% |
| Research & Development | 5.47B | 6.12B | 6.59B | 6.58B | 5.94B | 5.26B | 4.76B | 4.53B | 4.10B | 4.18B | 4.17B | 3.48B | 2.90B | 3.06B | 3.16B | 5.33B | 5.65B | 5.65B | 5.56B | 6.08B | 5.94B | 6.33B | 5.74B | 4.97B |
| General & Administrative | 2.81B | 3.53B | 4.05B | 4.04B | 3.81B | 3.42B | 3.71B | 3.33B | 3.87B | 3.97B | 3.86B | 4.06B | 3.29B | 13.36B | 13.00B | 18.51B | 18.97B | 17.96B | 17.74B | 18.31B | 18.36B | 17.86B | 17.55B | 16.24B |
| Selling & Marketing | 9.19B | 11.06B | 12.80B | 13.07B | 12.97B | 12.23B | 12.15B | 11.53B | 10.88B | 10.45B | 9.82B | 8.86B | 7.61B | 0.00 | 0.00 | 0.00 | 0.00 | 0.00 | 0.00 | 0.00 | 0.00 | 0.00 | 0.00 | 0.00 |
| SG&A | 12.00B | 14.59B | 16.85B | 17.10B | 16.77B | 15.65B | 15.86B | 14.86B | 14.74B | 14.42B | 13.68B | 12.92B | 10.90B | 13.36B | 13.00B | 18.51B | 18.97B | 17.96B | 17.74B | 18.31B | 18.36B | 17.86B | 17.55B | 16.24B |
| Other Expenses | -1.77B | -1.27B | 2.42B | -675.00M | -1.37B | -1.01B | -1.36B | -690.00M | -1.13B | -1.12B | -1.03B | -750.00M | -262.00M | 0.00 | 0.00 | 0.00 | 0.00 | 0.00 | 0.00 | 0.00 | 0.00 | 13.61B | 9.36B | 7.33B |
| Operating Expenses | 15.70B | 19.44B | 25.86B | 23.01B | 21.35B | 19.89B | 19.25B | 18.71B | 17.71B | 17.49B | 16.83B | 15.65B | 13.53B | 16.42B | 16.16B | 23.84B | 24.62B | 23.61B | 23.30B | 24.39B | 24.31B | 37.80B | 32.64B | 28.54B |
| Cost & Expenses | 118.92B | 148.16B | 169.44B | 157.30B | 151.35B | 141.19B | 136.92B | 120.39B | 110.17B | 106.27B | 97.85B | 90.64B | 79.10B | 90.91B | 91.69B | 149.52B | 147.42B | 138.09B | 133.04B | 145.95B | 152.92B | 158.94B | 141.59B | 124.97B |
| Interest Income | 212.00M | 220.00M | 397.00M | 271.00M | 214.00M | 230.00M | 170.00M | 145.00M | 212.00M | 828.00M | 285.00M | 825.00M | 0.00 | 0.00 | 0.00 | 0.00 | 0.00 | 0.00 | 0.00 | 0.00 | 0.00 | 0.00 | 0.00 | 0.00 |
| Interest Expense | 429.00M | 484.00M | 880.00M | 793.00M | 582.00M | 546.00M | 602.00M | 715.00M | 884.00M | 1.73B | 232.00M | 1.47B | -2.13B | 0.00 | 0.00 | 0.00 | 0.00 | 0.00 | 0.00 | 0.00 | 0.00 | 0.00 | 0.00 | 0.00 |
| Depreciation & Amortization | 6.98B | 8.96B | 7.75B | 6.31B | 5.68B | 5.48B | 5.38B | 5.00B | 4.37B | 4.07B | 3.58B | 3.36B | 3.26B | 5.64B | 8.02B | 13.67B | 12.64B | 11.25B | 11.40B | 13.64B | 14.30B | 13.61B | 9.36B | 7.33B |
| EBITDA | 35.18B | 15.40B | 12.13B | 17.36B | 20.22B | 18.34B | 18.44B | 15.56B | 13.51B | 13.11B | 11.89B | 11.29B | -1.16B | 8.15B | 16.34B | 17.61B | 16.00B | 14.89B | 12.82B | 19.53B | 12.86B | 23.50B | 19.64B | 15.23B |
| EBITDA Ratio | 26.27% | 9.98% | 7.02% | 10.37% | 12.30% | 11.97% | 12.34% | 11.98% | 11.45% | 11.47% | 11.16% | 11.55% | -1.46% | 8.48% | 16.41% | 11.62% | 10.69% | 10.49% | 9.41% | 13.05% | 8.40% | 14.48% | 13.09% | 11.55% |
| Operating Income | 28.20B | 6.15B | 3.31B | 10.06B | 12.98B | 12.07B | 12.54B | 9.48B | 7.81B | 8.62B | 8.76B | 7.27B | -172.00M | 5.23B | 7.88B | 2.07B | 2.25B | 3.86B | 3.16B | 3.77B | 215.79M | 3.37B | 8.50B | 6.86B |
| Operating Income Ratio | 21.06% | 3.99% | 1.92% | 6.01% | 7.90% | 7.88% | 8.39% | 7.30% | 6.62% | 7.54% | 8.22% | 7.44% | -0.22% | 5.44% | 7.91% | 1.37% | 1.50% | 2.72% | 2.32% | 2.52% | 0.14% | 2.08% | 5.67% | 5.21% |
| Total Other Income/Expenses | -12.39B | 189.00M | 520.00M | 537.00M | 1.32B | 500.00M | 201.00M | 694.00M | 2.33B | -897.00M | -306.00M | -646.00M | -2.13B | -2.42B | 1.32B | 1.92B | 1.19B | -326.79M | -2.60B | 2.29B | -1.66B | 1.09B | 1.14B | 1.16B |
| Income Before Tax | 15.81B | 6.34B | 3.83B | 10.60B | 14.30B | 12.57B | 12.74B | 10.17B | 10.14B | 7.72B | 8.45B | 6.63B | -2.30B | 2.80B | 9.20B | 3.99B | 3.44B | 3.53B | 559.79M | 6.06B | -1.44B | 4.46B | 9.65B | 8.03B |
| Income Before Tax Ratio | 11.81% | 4.11% | 2.22% | 6.33% | 8.70% | 8.20% | 8.53% | 7.83% | 8.59% | 6.75% | 7.93% | 6.78% | -2.91% | 2.92% | 9.24% | 2.63% | 2.30% | 2.49% | 0.41% | 4.05% | -0.94% | 2.75% | 6.43% | 6.09% |
| Income Tax Expense | 4.76B | 2.33B | 1.12B | 3.01B | 3.44B | 3.79B | 4.03B | 2.88B | 1.42B | 1.22B | 2.42B | 1.95B | 346.00M | 1.09B | 4.33B | 706.17M | 512.50M | 1.18B | 977.45M | 1.18B | -778.87M | 2.00B | 4.54B | 3.08B |
| Net Income | 11.05B | 3.63B | 2.38B | 7.25B | 10.53B | 8.53B | 8.42B | 6.96B | 6.84B | 6.10B | 5.67B | 4.50B | -2.64B | 1.42B | 3.99B | 3.23B | 2.84B | 2.46B | 446.24M | 4.72B | -663.11M | 7.89B | 5.75B | 4.82B |
| Net Income Ratio | 8.25% | 2.35% | 1.38% | 4.33% | 6.40% | 5.56% | 5.64% | 5.36% | 5.80% | 5.33% | 5.32% | 4.60% | -3.34% | 1.47% | 4.00% | 2.13% | 1.90% | 1.74% | 0.33% | 3.15% | -0.43% | 4.86% | 3.83% | 3.66% |
| EPS | 2.58 | 0.85 | 0.56 | 1.69 | 2.46 | 1.99 | 1.97 | 1.63 | 1.60 | 1.43 | 1.33 | 1.07 | -0.66 | 0.37 | 0.96 | 0.79 | 0.70 | 0.61 | 0.11 | 1.17 | -0.17 | 1.97 | 1.43 | 1.26 |
| EPS Diluted | 2.58 | 0.85 | 0.56 | 1.69 | 2.46 | 1.99 | 1.97 | 1.63 | 1.60 | 1.43 | 1.33 | 1.07 | -0.66 | 0.37 | 0.95 | 0.78 | 0.70 | 0.61 | 0.11 | 1.16 | -0.17 | 1.95 | 1.42 | 1.22 |
| Weighted Avg Shares Out | 4.28B | 4.28B | 4.28B | 4.28B | 4.28B | 4.28B | 4.28B | 4.28B | 4.28B | 4.27B | 4.26B | 4.20B | 4.02B | 3.83B | 4.15B | 4.09B | 4.08B | 4.04B | 4.05B | 4.03B | 4.01B | 4.01B | 4.01B | 3.84B |
| Weighted Avg Shares Out (Dil) | 4.28B | 4.28B | 4.28B | 4.28B | 4.28B | 4.28B | 4.28B | 4.28B | 4.28B | 4.27B | 4.27B | 4.21B | 4.02B | 3.84B | 4.18B | 4.11B | 4.08B | 4.04B | 4.05B | 4.06B | 4.01B | 4.06B | 4.05B | 3.95B |
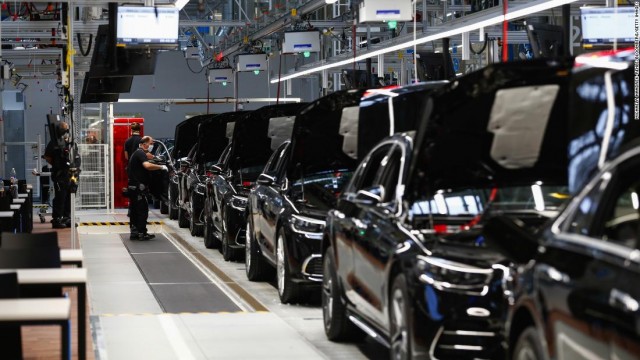
Mercedes warns 800,000 drivers of potential fire risk
Daimler says its EV concept car has over 621 miles of range and solar tech on roof
800,000 Mercedes-Benz Owners Warned Their Cars Could Catch Fire
Daimler warns car owners of fire risk it lacks parts to fix
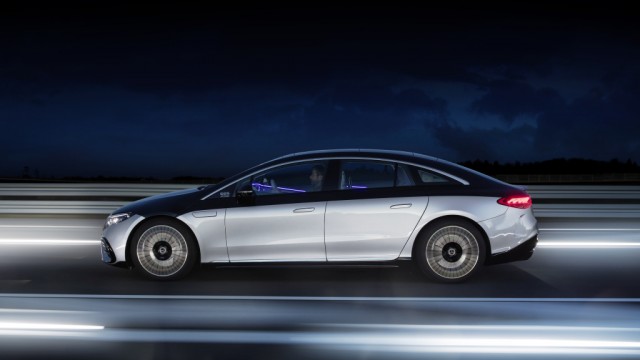
Mercedes unveils 1,000km range electric car to challenge Tesla and Lucid
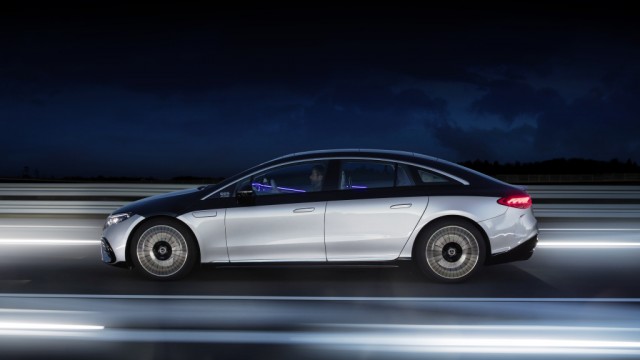
Mercedes unveils its 1,000km range electric vehicle

Mercedes unveils its 1000km range electric vehicle
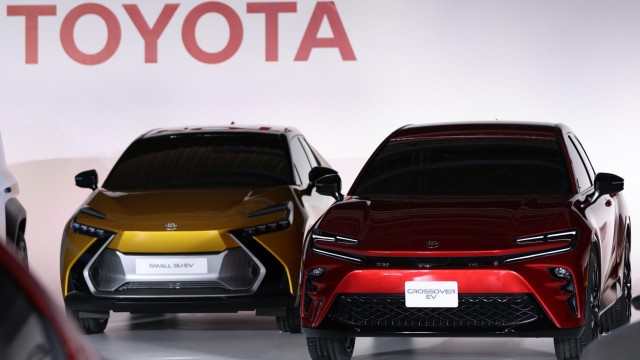
Toyota Announces New Self-Driving Auto Software, Challenging VW And Daimler
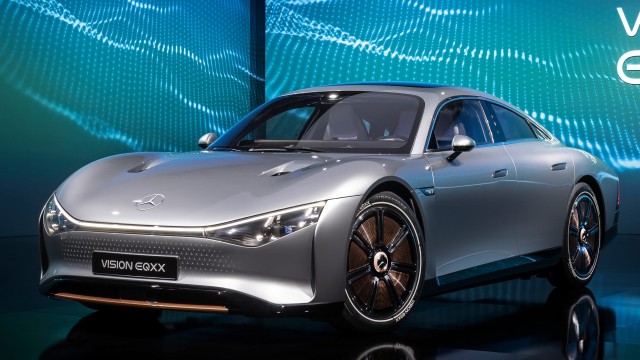
Mercedes-Benz revealed a sleek electric car with Tesla-crushing range, solar panels, and a 47.5-inch screen

Daimler expects chips to remain scarce in 2022
Source: https://incomestatements.info
Category: Stock Reports
