See more : gooddays holdings, Inc. (4437.T) Income Statement Analysis – Financial Results
Complete financial analysis of Fast Retailing Co., Ltd. (FRCOY) income statement, including revenue, profit margins, EPS and key performance metrics. Get detailed insights into the financial performance of Fast Retailing Co., Ltd., a leading company in the Apparel – Retail industry within the Consumer Cyclical sector.
- Olympia Industries Limited (OLYMPTX.BO) Income Statement Analysis – Financial Results
- Access Co., Ltd. (4813.T) Income Statement Analysis – Financial Results
- Bion Environmental Technologies, Inc. (BNET) Income Statement Analysis – Financial Results
- Treasure Factory Co.,LTD. (3093.T) Income Statement Analysis – Financial Results
- Wendt (India) Limited (WENDT.NS) Income Statement Analysis – Financial Results
Fast Retailing Co., Ltd. (FRCOY)
About Fast Retailing Co., Ltd.
Fast Retailing Co., Ltd., through its subsidiaries, operates as an apparel designer and retailer in Japan and internationally. The company operates through four segments: UNIQLO Japan, UNIQLO International, GU, and Global Brands. It manufactures and retails clothing for men, women, children, and babies; and lingerie, as well as other goods and items. The company operates stores and franchises under the UNIQLO, GU, PLST, Theory, COMPTOIR DES COTONNIERS, J Brand, and PRINCESSE TAM.TAM brand names. It also sells its products through online; and provides real estate leasing services. The company was formerly known as Ogori Shoji Co., Ltd. and changed its name to Fast Retailing Co., Ltd. in September 1991. Fast Retailing Co., Ltd. was founded in 1949 and is headquartered in Yamaguchi, Japan.
| Metric | 2024 | 2023 | 2022 | 2021 | 2020 | 2019 | 2018 | 2017 | 2016 | 2015 | 2014 | 2013 | 2012 | 2011 | 2010 | 2009 | 2008 | 2007 | 2006 | 2005 | 2004 | 2003 | 2002 | 2001 | 2000 |
|---|---|---|---|---|---|---|---|---|---|---|---|---|---|---|---|---|---|---|---|---|---|---|---|---|---|
| Revenue | 3,103.84B | 2,766.56B | 2,301.12B | 2,132.99B | 2,008.85B | 2,290.55B | 2,130.06B | 1,861.92B | 1,786.47B | 1,681.78B | 1,382.94B | 1,143.00B | 928.67B | 820.35B | 814.81B | 685.04B | 586.45B | 525.20B | 448.82B | 383.97B | 340.00B | 309.79B | 344.17B | 418.56B | 228.99B |
| Cost of Revenue | 1,430.76B | 1,330.20B | 1,094.26B | 1,059.04B | 1,033.00B | 1,170.99B | 1,080.12B | 952.67B | 921.48B | 833.24B | 683.16B | 578.99B | 453.20B | 394.58B | 393.93B | 343.52B | 292.77B | 276.81B | 236.40B | 213.68B | 176.81B | 172.72B | 193.77B | 218.74B | 116.49B |
| Gross Profit | 1,673.07B | 1,436.36B | 1,206.86B | 1,073.96B | 975.85B | 1,119.56B | 1,049.94B | 909.25B | 865.00B | 848.54B | 699.77B | 564.01B | 475.47B | 425.77B | 420.88B | 341.53B | 293.68B | 248.40B | 212.42B | 170.29B | 163.19B | 137.07B | 150.41B | 199.82B | 112.50B |
| Gross Profit Ratio | 53.90% | 51.92% | 52.45% | 50.35% | 48.58% | 48.88% | 49.29% | 48.83% | 48.42% | 50.45% | 50.60% | 49.34% | 51.20% | 51.90% | 51.65% | 49.85% | 50.08% | 47.30% | 47.33% | 44.35% | 48.00% | 44.24% | 43.70% | 47.74% | 49.13% |
| Research & Development | 0.00 | 0.00 | 0.00 | 0.00 | 0.00 | 0.00 | 0.00 | 0.00 | 0.00 | 0.00 | 0.00 | 0.00 | 0.00 | 0.00 | 0.00 | 0.00 | 0.00 | 0.00 | 0.00 | 0.00 | 0.00 | 0.00 | 0.00 | 0.00 | 0.00 |
| General & Administrative | 1,187.71B | 962.06B | 900.15B | 818.43B | 805.82B | 854.39B | 797.48B | 725.22B | 702.96B | 671.86B | 549.20B | 426.18B | 0.00 | 0.00 | 0.00 | 0.00 | 0.00 | 183.43B | 142.06B | 113.60B | 0.00 | 0.00 | 0.00 | 0.00 | 0.00 |
| Selling & Marketing | 0.00 | 92.31B | 79.27B | 66.58B | 68.31B | 74.44B | 70.31B | 0.00 | 71.61B | 68.47B | 60.94B | 52.69B | 0.00 | 0.00 | 0.00 | 0.00 | 0.00 | 0.00 | 0.00 | 20.25B | 18.29B | 19.28B | 19.67B | 19.08B | 10.04B |
| SG&A | 1,187.71B | 1,054.37B | 900.15B | 818.43B | 805.82B | 854.39B | 797.48B | 725.22B | 702.96B | 671.86B | 549.20B | 426.18B | 0.00 | 0.00 | 0.00 | 0.00 | 0.00 | 183.43B | 142.06B | 20.25B | 18.29B | 19.28B | 19.67B | 19.08B | 10.04B |
| Other Expenses | -15.55B | 903.00M | 0.00 | 0.00 | 0.00 | 0.00 | 0.00 | 0.00 | 0.00 | 0.00 | 0.00 | 80.00M | -737.00M | -770.00M | -909.00M | -86.00M | -18.00M | 0.00 | 0.00 | 0.00 | 0.00 | 0.00 | 0.00 | 0.00 | 0.00 |
| Operating Expenses | 1,172.17B | 1,055.27B | 910.59B | 825.50B | 826.82B | 862.49B | 814.34B | 732.84B | 737.71B | 684.07B | 569.37B | 431.09B | 349.02B | 309.40B | 288.50B | 232.89B | 206.19B | 183.43B | 142.06B | 113.60B | 99.24B | 95.75B | 99.99B | 97.74B | 51.87B |
| Cost & Expenses | 2,602.93B | 2,385.47B | 2,004.86B | 1,884.54B | 1,859.82B | 2,033.47B | 1,894.46B | 1,685.50B | 1,659.18B | 1,517.32B | 1,252.53B | 1,010.08B | 802.22B | 703.98B | 682.43B | 576.40B | 498.96B | 460.24B | 378.46B | 327.28B | 276.05B | 268.48B | 293.75B | 316.48B | 168.36B |
| Interest Income | 67.40B | 66.72B | 123.82B | 23.86B | 11.23B | 12.29B | 9.69B | 19.92B | 2.36B | 17.35B | 6.00B | 1.03B | 1.22B | 408.00M | 344.00M | 847.00M | 2.24B | 1.31B | 1.05B | 790.00M | 506.00M | 374.00M | 677.00M | 1.06B | 618.00M |
| Interest Expense | 11.10B | 9.89B | 7.56B | 7.00B | 7.71B | 17.48B | 3.23B | 2.93B | 39.42B | 1.14B | 933.00M | 633.00M | 568.00M | 532.00M | 500.00M | 917.00M | 1.64B | 1.78B | 854.00M | 344.00M | 169.00M | 332.00M | 407.00M | 137.00M | 159.00M |
| Depreciation & Amortization | 204.39B | 186.87B | 180.28B | 177.91B | 177.85B | 48.48B | 45.06B | 39.69B | 36.80B | 37.76B | 30.81B | 28.99B | 24.24B | 25.35B | 19.76B | 16.22B | 13.84B | 10.82B | 6.51B | 7.94B | 2.87B | 2.36B | 1.94B | 1.57B | 805.00M |
| EBITDA | 772.69B | 634.68B | 601.42B | 450.78B | 338.42B | 318.40B | 290.96B | 236.02B | 166.45B | 219.58B | 167.21B | 179.98B | 148.20B | 119.76B | 137.13B | 112.62B | 101.19B | 76.90B | 80.12B | 66.29B | 59.49B | 37.45B | 52.80B | 104.24B | 60.97B |
| EBITDA Ratio | 24.89% | 22.94% | 26.14% | 21.13% | 16.85% | 13.90% | 13.66% | 12.68% | 9.32% | 13.06% | 12.09% | 15.63% | 16.15% | 16.21% | 17.67% | 17.29% | 17.25% | 14.64% | 17.95% | 18.10% | 18.08% | 12.76% | 15.41% | 25.02% | 26.88% |
| Operating Income | 500.90B | 381.09B | 297.33B | 249.01B | 149.35B | 257.64B | 236.21B | 176.41B | 127.29B | 164.46B | 130.40B | 132.92B | 125.78B | 107.62B | 124.25B | 102.22B | 87.35B | 66.08B | 74.06B | 61.55B | 58.60B | 37.16B | 51.10B | 103.14B | 60.74B |
| Operating Income Ratio | 16.14% | 13.77% | 12.92% | 11.67% | 7.43% | 11.25% | 11.09% | 9.47% | 7.13% | 9.78% | 9.43% | 11.63% | 13.54% | 13.12% | 15.25% | 14.92% | 14.90% | 12.58% | 16.50% | 16.03% | 17.24% | 11.99% | 14.85% | 24.64% | 26.52% |
| Total Other Income/Expenses | 56.30B | 56.83B | 116.26B | 16.86B | 3.52B | -5.19B | 6.47B | 16.98B | -37.06B | 16.21B | 5.07B | 21.63B | -3.06B | -22.49B | -15.51B | -13.15B | -5.50B | -2.25B | -1.31B | 1.32B | -7.51B | -6.56B | -649.00M | 452.00M | -626.00M |
| Income Before Tax | 557.20B | 437.92B | 413.58B | 265.87B | 152.87B | 252.45B | 242.68B | 193.40B | 90.24B | 180.68B | 135.47B | 141.53B | 123.39B | 93.88B | 116.87B | 95.49B | 81.99B | 62.71B | 72.75B | 58.02B | 56.45B | 34.75B | 50.45B | 102.53B | 60.00B |
| Income Before Tax Ratio | 17.95% | 15.83% | 17.97% | 12.46% | 7.61% | 11.02% | 11.39% | 10.39% | 5.05% | 10.74% | 9.80% | 12.38% | 13.29% | 11.44% | 14.34% | 13.94% | 13.98% | 11.94% | 16.21% | 15.11% | 16.60% | 11.22% | 14.66% | 24.50% | 26.20% |
| Income Tax Expense | 163.60B | 122.75B | 128.83B | 90.19B | 62.47B | 74.40B | 73.30B | 64.49B | 36.16B | 63.29B | 56.13B | 48.27B | 48.96B | 37.57B | 54.22B | 45.43B | 38.13B | 30.77B | 30.93B | 24.06B | 25.08B | 13.82B | 22.60B | 43.34B | 25.49B |
| Net Income | 372.00B | 296.23B | 273.34B | 169.85B | 90.36B | 162.58B | 154.81B | 119.28B | 48.05B | 110.03B | 74.55B | 104.60B | 71.65B | 54.35B | 61.68B | 49.80B | 43.53B | 31.78B | 40.44B | 33.88B | 31.37B | 20.93B | 27.85B | 59.19B | 34.51B |
| Net Income Ratio | 11.99% | 10.71% | 11.88% | 7.96% | 4.50% | 7.10% | 7.27% | 6.41% | 2.69% | 6.54% | 5.39% | 9.15% | 7.72% | 6.63% | 7.57% | 7.27% | 7.42% | 6.05% | 9.01% | 8.82% | 9.23% | 6.76% | 8.09% | 14.14% | 15.07% |
| EPS | 0.00 | 964.48 | 89.18 | 554.37 | 295.05 | 53.11 | 50.59 | 38.99 | 15.71 | 35.98 | 24.38 | 34.22 | 23.45 | 17.80 | 20.20 | 16.30 | 14.25 | 10.40 | 13.25 | 11.07 | 10.16 | 6.77 | 8.98 | 37.31 | 21.70 |
| EPS Diluted | 0.00 | 964.48 | 89.04 | 553.48 | 294.54 | 53.02 | 50.51 | 38.93 | 15.69 | 35.94 | 24.36 | 34.19 | 23.44 | 17.79 | 20.20 | 16.30 | 14.25 | 10.40 | 13.24 | 11.07 | 10.16 | 6.77 | 8.98 | 37.31 | 21.70 |
| Weighted Avg Shares Out | 0.00 | 307.14M | 3.07B | 3.06B | 3.06B | 3.06B | 3.06B | 3.06B | 3.06B | 3.06B | 3.06B | 3.06B | 3.06B | 3.05B | 3.05B | 3.06B | 3.06B | 3.06B | 3.05B | 3.18B | 3.18B | 3.18B | 3.18B | 3.18B | 3.18B |
| Weighted Avg Shares Out (Dil) | 0.00 | 307.14M | 3.07B | 3.07B | 3.07B | 3.07B | 3.07B | 3.06B | 3.06B | 3.06B | 3.06B | 3.06B | 3.06B | 3.06B | 3.05B | 3.06B | 3.06B | 3.06B | 3.05B | 3.18B | 3.18B | 3.18B | 3.18B | 3.18B | 3.18B |

3 Deeply Undervalued Japanese Stocks to Buy Now: May 2024

Japan's Nikkei reclaims 39,000 level for first time since April

Uniqlo owner Fast Retailing Q1 profit soars on strong overseas sales
Fast Retailing shares jump after record profit, earnings growth projections
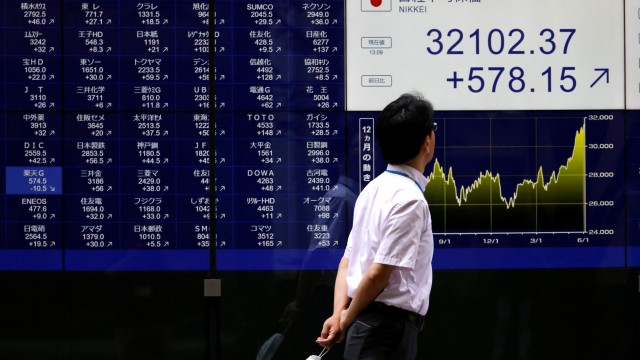
Fast Retailing, trading houses lift Japan's Nikkei to 33-year high

Fast Retailing: The Dream Of Global Domination Is Very Much Alive
Nikkei 225 forecast as Fast Retailing and Recruit stocks plunge
Uniqlo owner gives Japan Inc a jolt with 40% wage hike

7 Growth Stock Predictions for 2023

The 7 Best OTC Stocks to Buy in September
Source: https://incomestatements.info
Category: Stock Reports
