See more : Future Bright Mining Holdings Limited (2212.HK) Income Statement Analysis – Financial Results
Complete financial analysis of International Consolidated Airlines Group S.A. (ICAGY) income statement, including revenue, profit margins, EPS and key performance metrics. Get detailed insights into the financial performance of International Consolidated Airlines Group S.A., a leading company in the Airlines, Airports & Air Services industry within the Industrials sector.
- EZTEC Empreendimentos e Participações S.A. (EZTC3.SA) Income Statement Analysis – Financial Results
- Nedbank Group Limited (NDBKY) Income Statement Analysis – Financial Results
- Orange S.A. (ORAN) Income Statement Analysis – Financial Results
- Generac Holdings Inc. (GNRC) Income Statement Analysis – Financial Results
- Hays plc (HAS.L) Income Statement Analysis – Financial Results
International Consolidated Airlines Group S.A. (ICAGY)
About International Consolidated Airlines Group S.A.
International Consolidated Airlines Group, S.A., together with its subsidiaries, engages in the provision of passenger and cargo transportation services in the United Kingdom, Spain, Ireland, the United States, and rest of the world. The company operates under the British Airways, Iberia, Vueling, Aer Lingus, and LEVEL brands. It operates a fleet of 531 aircraft. The company was incorporated in 2009 and is based in Madrid, Spain.
| Metric | 2023 | 2022 | 2021 | 2020 | 2019 | 2018 | 2017 | 2016 | 2015 | 2014 | 2013 | 2012 | 2011 | 2010 | 2008 | 2007 | 2006 | 2005 | 2004 | 2003 |
|---|---|---|---|---|---|---|---|---|---|---|---|---|---|---|---|---|---|---|---|---|
| Revenue | 29.45B | 23.07B | 8.46B | 7.81B | 25.51B | 24.26B | 22.88B | 22.57B | 22.86B | 20.17B | 18.64B | 18.12B | 16.10B | 7.89B | 9.71B | 10.94B | 12.51B | 11.77B | 11.30B | 11.31B |
| Cost of Revenue | 21.54B | 17.70B | 8.29B | 8.91B | 18.24B | 17.71B | 16.86B | 16.87B | 17.51B | 15.76B | 15.20B | 16.89B | 0.00 | 0.00 | 8.70B | 8.70B | 10.78B | 10.75B | 10.40B | 10.48B |
| Gross Profit | 7.91B | 5.36B | 164.00M | -1.10B | 7.26B | 6.55B | 6.02B | 5.70B | 5.35B | 4.41B | 3.44B | 1.23B | 16.10B | 7.89B | 1.01B | 2.24B | 1.73B | 1.02B | 897.07M | 825.53M |
| Gross Profit Ratio | 26.86% | 23.25% | 1.94% | -14.10% | 28.48% | 26.99% | 26.30% | 25.26% | 23.41% | 21.86% | 18.44% | 6.79% | 100.00% | 100.00% | 10.39% | 20.48% | 13.81% | 8.66% | 7.94% | 7.30% |
| Research & Development | 0.00 | 0.00 | 0.00 | 0.00 | 0.00 | 0.00 | 0.00 | 0.00 | 0.00 | 0.00 | 0.00 | 0.00 | 375.00M | 60.00M | 0.00 | 0.00 | 0.00 | 0.00 | 0.00 | 0.00 |
| General & Administrative | 0.00 | 973.00M | 758.00M | 754.00M | 811.00M | 918.00M | 0.00 | 0.00 | 0.00 | 0.00 | 0.00 | 0.00 | 0.00 | 0.00 | 0.00 | 0.00 | 0.00 | 0.00 | 0.00 | 0.00 |
| Selling & Marketing | 1.16B | 920.00M | 434.00M | 405.00M | 1.04B | 1.05B | 982.00M | 896.00M | 912.00M | 859.00M | 785.00M | 837.00M | 740.00M | 277.00M | 0.00 | 0.00 | 0.00 | 0.00 | 0.00 | 0.00 |
| SG&A | 1.16B | 1.89B | 1.19B | 1.16B | 1.85B | 1.96B | 1.90B | 1.77B | 1.71B | 1.79B | 1.71B | 837.00M | 740.00M | 277.00M | 398.36M | 452.80M | 761.76M | 804.10M | 175.93M | 219.84M |
| Other Expenses | 3.25B | 0.00 | 0.00 | -70.51M | 0.00 | 0.00 | 0.00 | 0.00 | 0.00 | 0.00 | 0.00 | 2.34B | 14.37B | 7.19B | -631.55M | 4.37B | 0.00 | 804.10M | 175.93M | 0.00 |
| Operating Expenses | 4.40B | 4.02B | 2.91B | 6.11B | 4.43B | 2.86B | 3.34B | 3.09B | 3.30B | 3.37B | 2.96B | 1.84B | 15.49B | 7.53B | 1.03B | -3.92B | 761.76M | 1.61B | 351.85M | 219.84M |
| Cost & Expenses | 25.95B | 21.72B | 11.20B | 15.02B | 22.67B | 20.57B | 20.20B | 19.96B | 20.80B | 19.13B | 18.16B | 18.73B | 15.49B | 7.53B | 9.73B | 4.78B | 11.55B | 10.75B | 10.40B | 10.70B |
| Interest Income | 471.00M | 928.00M | 763.00M | 616.00M | 560.00M | 198.00M | 196.00M | 245.00M | 253.00M | 216.00M | 253.00M | 53.00M | 269.00M | 21.00M | 102.56M | 139.23M | 190.07M | 131.87M | 120.68M | 94.22M |
| Interest Expense | 1.10B | 979.00M | 768.00M | 637.00M | 607.00M | 231.00M | 224.00M | 278.00M | 295.00M | 248.00M | 284.00M | 259.00M | 196.00M | 189.00M | 182.45M | 220.76M | 251.96M | 309.60M | 385.29M | 382.85M |
| Depreciation & Amortization | 801.00M | 805.00M | 691.00M | 774.00M | 827.00M | 1.13B | 1.07B | 1.27B | 1.30B | 1.19B | 995.00M | 1.41B | 969.00M | 671.00M | 743.83M | 867.97M | 1.05B | 1.04B | 1.05B | 1.02B |
| EBITDA | 4.44B | 2.20B | -2.25B | -5.08B | 4.13B | 4.46B | 4.01B | 3.93B | 3.64B | 2.62B | 1.73B | 537.00M | 1.75B | 1.06B | 722.23M | 7.03B | 2.02B | 2.06B | 1.95B | 1.62B |
| EBITDA Ratio | 15.06% | 9.52% | -26.65% | -45.66% | 16.20% | 18.39% | 17.53% | 17.43% | 15.92% | 13.00% | 9.28% | 3.76% | 10.95% | 13.01% | 7.44% | 64.25% | 16.16% | 17.51% | 17.24% | 14.34% |
| Operating Income | 3.51B | 1.39B | -2.94B | -4.34B | 3.30B | 3.33B | 2.94B | 2.66B | 2.34B | 1.44B | 734.00M | -613.00M | 522.00M | 418.00M | -21.59M | 6.16B | 966.57M | 1.02B | 897.07M | 605.69M |
| Operating Income Ratio | 11.91% | 6.03% | -34.82% | -55.57% | 12.95% | 13.73% | 12.83% | 11.79% | 10.23% | 7.11% | 3.94% | -3.38% | 3.24% | 5.30% | -0.22% | 56.32% | 7.72% | 8.66% | 7.94% | 5.36% |
| Total Other Income/Expenses | -451.00M | -863.00M | -742.00M | -376.00M | -338.00M | -191.00M | -181.00M | -122.00M | -517.00M | -201.00M | -300.00M | -161.00M | 20.00M | -217.00M | -415.64M | -5.04B | -73.67M | -176.30M | -186.10M | -336.49M |
| Income Before Tax | 3.06B | 415.00M | -3.51B | -7.83B | 2.28B | 3.49B | 2.48B | 2.36B | 1.80B | 828.00M | 227.00M | -997.00M | 542.00M | 201.00M | -437.23M | 1.12B | 892.90M | 842.80M | 710.97M | 269.19M |
| Income Before Tax Ratio | 10.38% | 1.80% | -41.48% | -100.27% | 8.92% | 14.37% | 10.84% | 10.47% | 7.88% | 4.11% | 1.22% | -5.50% | 3.37% | 2.55% | -4.50% | 10.27% | 7.14% | 7.16% | 6.29% | 2.38% |
| Income Tax Expense | 401.00M | 16.00M | 574.00M | 892.00M | 560.00M | 590.00M | 472.00M | 410.00M | 285.00M | 175.00M | 76.00M | -112.00M | -40.00M | -11.00M | -46.42M | 243.33M | 254.90M | 217.87M | 175.93M | 98.70M |
| Net Income | 2.66B | 431.00M | -2.93B | -6.94B | 1.72B | 2.89B | 1.99B | 1.93B | 1.50B | 982.00M | 126.00M | -943.00M | 562.00M | 197.00M | -404.84M | 893.06M | 624.73M | 646.43M | 548.13M | 194.42M |
| Net Income Ratio | 9.01% | 1.87% | -34.69% | -88.84% | 6.72% | 11.89% | 8.69% | 8.56% | 6.54% | 4.87% | 0.68% | -5.21% | 3.49% | 2.50% | -4.17% | 8.16% | 4.99% | 5.49% | 4.85% | 1.72% |
| EPS | 0.51 | 0.09 | -0.59 | -1.97 | 0.86 | 1.37 | 0.95 | 0.93 | 0.73 | 0.48 | 0.07 | -0.51 | 0.31 | 0.17 | -0.23 | 0.51 | 0.36 | 0.38 | 0.34 | 0.12 |
| EPS Diluted | 0.50 | 0.06 | -0.59 | -1.97 | 0.84 | 1.37 | 0.92 | 0.89 | 0.70 | 0.46 | 0.07 | -0.46 | 0.30 | 0.17 | -0.23 | 0.51 | 0.36 | 0.38 | 0.32 | 0.12 |
| Weighted Avg Shares Out | 5.25B | 4.96B | 4.96B | 3.53B | 2.03B | 2.10B | 2.16B | 2.18B | 2.12B | 2.12B | 1.94B | 1.85B | 1.81B | 1.15B | 1.74B | 1.74B | 1.72B | 1.68B | 1.62B | 1.61B |
| Weighted Avg Shares Out (Dil) | 5.28B | 5.34B | 4.96B | 3.53B | 2.07B | 2.11B | 2.18B | 2.21B | 2.16B | 2.16B | 1.95B | 2.07B | 2.01B | 1.15B | 1.74B | 1.75B | 1.74B | 1.72B | 1.70B | 1.61B |

Air France-KLM sinks to loss in fourth quarter as British Airways owner IAG posts record profits
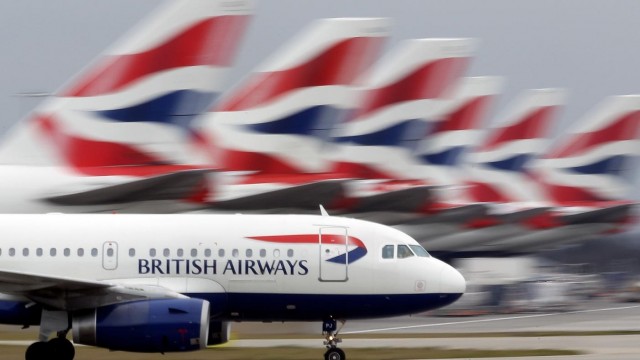
IAG Shares Rise On News Of Record Profits, No Dividends Yet
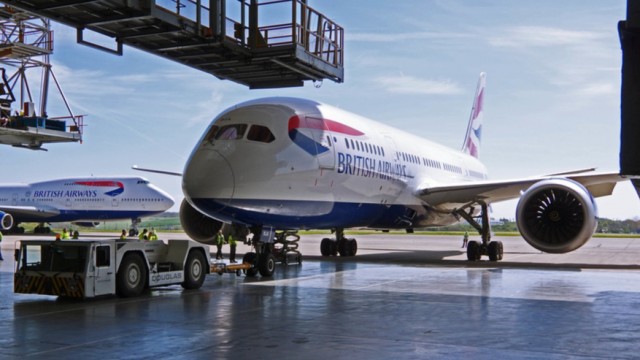
BA owner IAG more than double profits despite final quarter coming in short
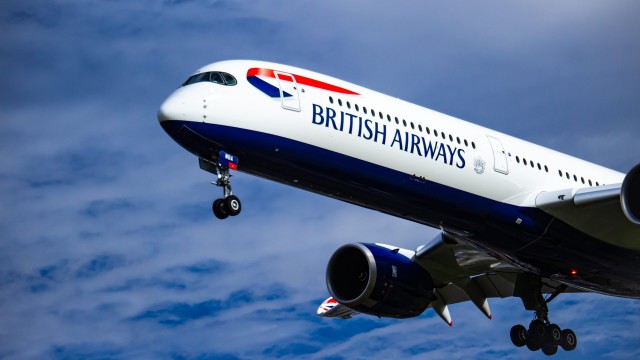
IAG share price nears key level ahead of FY earnings: buy, sell, hold?
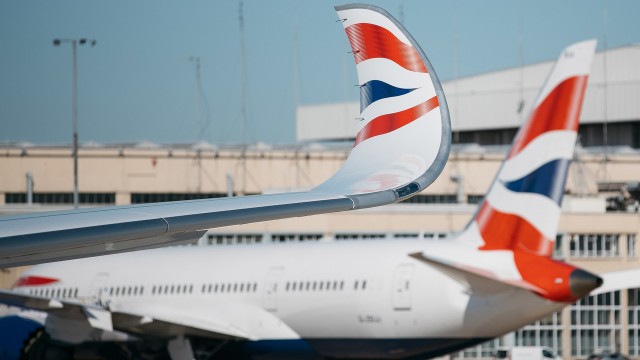
British Airways, Ocado and Haleon to set next week's pace
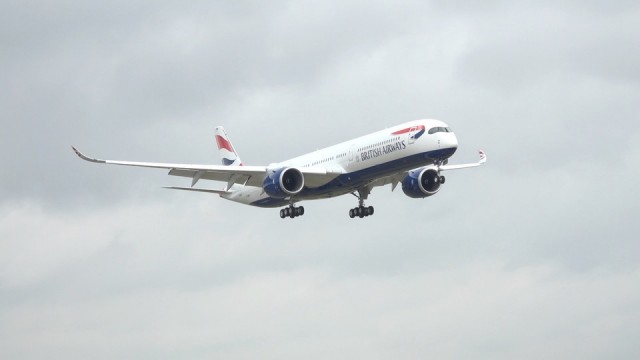
British Airways owner expecting record year on post-pandemic boom

Should Value Investors Buy International Consolidated Airlines Group (ICAGY) Stock?

ICAGY or ULCC: Which Is the Better Value Stock Right Now?
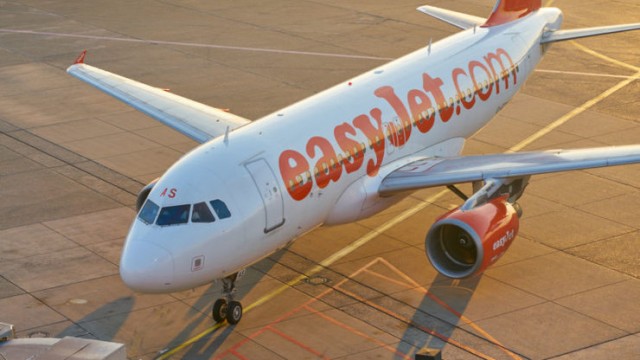
EasyJet share price always beats British Airways' IAG: Here's why
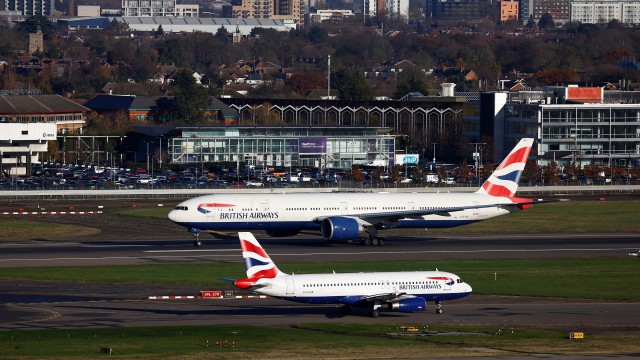
IAG's bid to buy out Air Europa may lessen competition, EU says
Source: https://incomestatements.info
Category: Stock Reports
