See more : AB Volvo (publ) (VLVLY) Income Statement Analysis – Financial Results
Complete financial analysis of International Consolidated Airlines Group S.A. (ICAGY) income statement, including revenue, profit margins, EPS and key performance metrics. Get detailed insights into the financial performance of International Consolidated Airlines Group S.A., a leading company in the Airlines, Airports & Air Services industry within the Industrials sector.
- Fathom Nickel Inc. (FNI.CN) Income Statement Analysis – Financial Results
- DN Holdings Co.,Ltd. (7377.T) Income Statement Analysis – Financial Results
- Naturally Splendid Enterprises Ltd. (NSPDF) Income Statement Analysis – Financial Results
- Big Yellow Group Plc (BYG.L) Income Statement Analysis – Financial Results
- Invesco Mortgage Capital Inc. (IVR) Income Statement Analysis – Financial Results
International Consolidated Airlines Group S.A. (ICAGY)
About International Consolidated Airlines Group S.A.
International Consolidated Airlines Group, S.A., together with its subsidiaries, engages in the provision of passenger and cargo transportation services in the United Kingdom, Spain, Ireland, the United States, and rest of the world. The company operates under the British Airways, Iberia, Vueling, Aer Lingus, and LEVEL brands. It operates a fleet of 531 aircraft. The company was incorporated in 2009 and is based in Madrid, Spain.
| Metric | 2023 | 2022 | 2021 | 2020 | 2019 | 2018 | 2017 | 2016 | 2015 | 2014 | 2013 | 2012 | 2011 | 2010 | 2008 | 2007 | 2006 | 2005 | 2004 | 2003 |
|---|---|---|---|---|---|---|---|---|---|---|---|---|---|---|---|---|---|---|---|---|
| Revenue | 29.45B | 23.07B | 8.46B | 7.81B | 25.51B | 24.26B | 22.88B | 22.57B | 22.86B | 20.17B | 18.64B | 18.12B | 16.10B | 7.89B | 9.71B | 10.94B | 12.51B | 11.77B | 11.30B | 11.31B |
| Cost of Revenue | 21.54B | 17.70B | 8.29B | 8.91B | 18.24B | 17.71B | 16.86B | 16.87B | 17.51B | 15.76B | 15.20B | 16.89B | 0.00 | 0.00 | 8.70B | 8.70B | 10.78B | 10.75B | 10.40B | 10.48B |
| Gross Profit | 7.91B | 5.36B | 164.00M | -1.10B | 7.26B | 6.55B | 6.02B | 5.70B | 5.35B | 4.41B | 3.44B | 1.23B | 16.10B | 7.89B | 1.01B | 2.24B | 1.73B | 1.02B | 897.07M | 825.53M |
| Gross Profit Ratio | 26.86% | 23.25% | 1.94% | -14.10% | 28.48% | 26.99% | 26.30% | 25.26% | 23.41% | 21.86% | 18.44% | 6.79% | 100.00% | 100.00% | 10.39% | 20.48% | 13.81% | 8.66% | 7.94% | 7.30% |
| Research & Development | 0.00 | 0.00 | 0.00 | 0.00 | 0.00 | 0.00 | 0.00 | 0.00 | 0.00 | 0.00 | 0.00 | 0.00 | 375.00M | 60.00M | 0.00 | 0.00 | 0.00 | 0.00 | 0.00 | 0.00 |
| General & Administrative | 0.00 | 973.00M | 758.00M | 754.00M | 811.00M | 918.00M | 0.00 | 0.00 | 0.00 | 0.00 | 0.00 | 0.00 | 0.00 | 0.00 | 0.00 | 0.00 | 0.00 | 0.00 | 0.00 | 0.00 |
| Selling & Marketing | 1.16B | 920.00M | 434.00M | 405.00M | 1.04B | 1.05B | 982.00M | 896.00M | 912.00M | 859.00M | 785.00M | 837.00M | 740.00M | 277.00M | 0.00 | 0.00 | 0.00 | 0.00 | 0.00 | 0.00 |
| SG&A | 1.16B | 1.89B | 1.19B | 1.16B | 1.85B | 1.96B | 1.90B | 1.77B | 1.71B | 1.79B | 1.71B | 837.00M | 740.00M | 277.00M | 398.36M | 452.80M | 761.76M | 804.10M | 175.93M | 219.84M |
| Other Expenses | 3.25B | 0.00 | 0.00 | -70.51M | 0.00 | 0.00 | 0.00 | 0.00 | 0.00 | 0.00 | 0.00 | 2.34B | 14.37B | 7.19B | -631.55M | 4.37B | 0.00 | 804.10M | 175.93M | 0.00 |
| Operating Expenses | 4.40B | 4.02B | 2.91B | 6.11B | 4.43B | 2.86B | 3.34B | 3.09B | 3.30B | 3.37B | 2.96B | 1.84B | 15.49B | 7.53B | 1.03B | -3.92B | 761.76M | 1.61B | 351.85M | 219.84M |
| Cost & Expenses | 25.95B | 21.72B | 11.20B | 15.02B | 22.67B | 20.57B | 20.20B | 19.96B | 20.80B | 19.13B | 18.16B | 18.73B | 15.49B | 7.53B | 9.73B | 4.78B | 11.55B | 10.75B | 10.40B | 10.70B |
| Interest Income | 471.00M | 928.00M | 763.00M | 616.00M | 560.00M | 198.00M | 196.00M | 245.00M | 253.00M | 216.00M | 253.00M | 53.00M | 269.00M | 21.00M | 102.56M | 139.23M | 190.07M | 131.87M | 120.68M | 94.22M |
| Interest Expense | 1.10B | 979.00M | 768.00M | 637.00M | 607.00M | 231.00M | 224.00M | 278.00M | 295.00M | 248.00M | 284.00M | 259.00M | 196.00M | 189.00M | 182.45M | 220.76M | 251.96M | 309.60M | 385.29M | 382.85M |
| Depreciation & Amortization | 801.00M | 805.00M | 691.00M | 774.00M | 827.00M | 1.13B | 1.07B | 1.27B | 1.30B | 1.19B | 995.00M | 1.41B | 969.00M | 671.00M | 743.83M | 867.97M | 1.05B | 1.04B | 1.05B | 1.02B |
| EBITDA | 4.44B | 2.20B | -2.25B | -5.08B | 4.13B | 4.46B | 4.01B | 3.93B | 3.64B | 2.62B | 1.73B | 537.00M | 1.75B | 1.06B | 722.23M | 7.03B | 2.02B | 2.06B | 1.95B | 1.62B |
| EBITDA Ratio | 15.06% | 9.52% | -26.65% | -45.66% | 16.20% | 18.39% | 17.53% | 17.43% | 15.92% | 13.00% | 9.28% | 3.76% | 10.95% | 13.01% | 7.44% | 64.25% | 16.16% | 17.51% | 17.24% | 14.34% |
| Operating Income | 3.51B | 1.39B | -2.94B | -4.34B | 3.30B | 3.33B | 2.94B | 2.66B | 2.34B | 1.44B | 734.00M | -613.00M | 522.00M | 418.00M | -21.59M | 6.16B | 966.57M | 1.02B | 897.07M | 605.69M |
| Operating Income Ratio | 11.91% | 6.03% | -34.82% | -55.57% | 12.95% | 13.73% | 12.83% | 11.79% | 10.23% | 7.11% | 3.94% | -3.38% | 3.24% | 5.30% | -0.22% | 56.32% | 7.72% | 8.66% | 7.94% | 5.36% |
| Total Other Income/Expenses | -451.00M | -863.00M | -742.00M | -376.00M | -338.00M | -191.00M | -181.00M | -122.00M | -517.00M | -201.00M | -300.00M | -161.00M | 20.00M | -217.00M | -415.64M | -5.04B | -73.67M | -176.30M | -186.10M | -336.49M |
| Income Before Tax | 3.06B | 415.00M | -3.51B | -7.83B | 2.28B | 3.49B | 2.48B | 2.36B | 1.80B | 828.00M | 227.00M | -997.00M | 542.00M | 201.00M | -437.23M | 1.12B | 892.90M | 842.80M | 710.97M | 269.19M |
| Income Before Tax Ratio | 10.38% | 1.80% | -41.48% | -100.27% | 8.92% | 14.37% | 10.84% | 10.47% | 7.88% | 4.11% | 1.22% | -5.50% | 3.37% | 2.55% | -4.50% | 10.27% | 7.14% | 7.16% | 6.29% | 2.38% |
| Income Tax Expense | 401.00M | 16.00M | 574.00M | 892.00M | 560.00M | 590.00M | 472.00M | 410.00M | 285.00M | 175.00M | 76.00M | -112.00M | -40.00M | -11.00M | -46.42M | 243.33M | 254.90M | 217.87M | 175.93M | 98.70M |
| Net Income | 2.66B | 431.00M | -2.93B | -6.94B | 1.72B | 2.89B | 1.99B | 1.93B | 1.50B | 982.00M | 126.00M | -943.00M | 562.00M | 197.00M | -404.84M | 893.06M | 624.73M | 646.43M | 548.13M | 194.42M |
| Net Income Ratio | 9.01% | 1.87% | -34.69% | -88.84% | 6.72% | 11.89% | 8.69% | 8.56% | 6.54% | 4.87% | 0.68% | -5.21% | 3.49% | 2.50% | -4.17% | 8.16% | 4.99% | 5.49% | 4.85% | 1.72% |
| EPS | 0.51 | 0.09 | -0.59 | -1.97 | 0.86 | 1.37 | 0.95 | 0.93 | 0.73 | 0.48 | 0.07 | -0.51 | 0.31 | 0.17 | -0.23 | 0.51 | 0.36 | 0.38 | 0.34 | 0.12 |
| EPS Diluted | 0.50 | 0.06 | -0.59 | -1.97 | 0.84 | 1.37 | 0.92 | 0.89 | 0.70 | 0.46 | 0.07 | -0.46 | 0.30 | 0.17 | -0.23 | 0.51 | 0.36 | 0.38 | 0.32 | 0.12 |
| Weighted Avg Shares Out | 5.25B | 4.96B | 4.96B | 3.53B | 2.03B | 2.10B | 2.16B | 2.18B | 2.12B | 2.12B | 1.94B | 1.85B | 1.81B | 1.15B | 1.74B | 1.74B | 1.72B | 1.68B | 1.62B | 1.61B |
| Weighted Avg Shares Out (Dil) | 5.28B | 5.34B | 4.96B | 3.53B | 2.07B | 2.11B | 2.18B | 2.21B | 2.16B | 2.16B | 1.95B | 2.07B | 2.01B | 1.15B | 1.74B | 1.75B | 1.74B | 1.72B | 1.70B | 1.61B |

British Airways and Easyjet travellers hit by air traffic disruption

Air fares will rise due to emissions targets, warns British Airways owner

International Airlines Group: Cost Execution And Volume Growth

Volotea, Abra team up to take over slots from potential IAG-Air Europa merger remedies

Are Investors Undervaluing International Consolidated Airlines Group (ICAGY) Right Now?

British Airways owner touted for fresh share buyback - analyst

3 Airline Stocks to Buy Now: June 2024

EU vets IAG rivals' ability to take over Air Europa routes, sources say
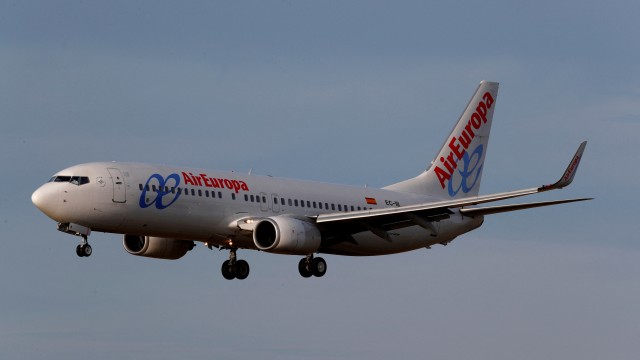
IAG offers remedies to EU over Air Europa deal
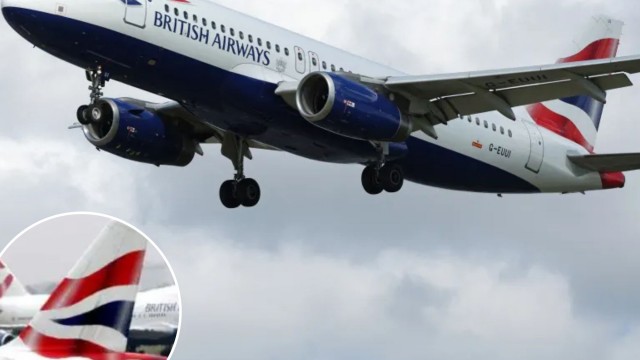
British Airways' massive $9B overhaul includes new lounges, upgraded seats
Source: https://incomestatements.info
Category: Stock Reports
