See more : Solvay SA (SVYSF) Income Statement Analysis – Financial Results
Complete financial analysis of International Consolidated Airlines Group S.A. (ICAGY) income statement, including revenue, profit margins, EPS and key performance metrics. Get detailed insights into the financial performance of International Consolidated Airlines Group S.A., a leading company in the Airlines, Airports & Air Services industry within the Industrials sector.
- CAR Inc. (0699.HK) Income Statement Analysis – Financial Results
- Gooi Global, Inc. (GOOI) Income Statement Analysis – Financial Results
- Asante Gold Corporation (ASE.CN) Income Statement Analysis – Financial Results
- Surge Copper Corp. (SRGXF) Income Statement Analysis – Financial Results
- Tontek Design Technology Ltd. (5487.TWO) Income Statement Analysis – Financial Results
International Consolidated Airlines Group S.A. (ICAGY)
About International Consolidated Airlines Group S.A.
International Consolidated Airlines Group, S.A., together with its subsidiaries, engages in the provision of passenger and cargo transportation services in the United Kingdom, Spain, Ireland, the United States, and rest of the world. The company operates under the British Airways, Iberia, Vueling, Aer Lingus, and LEVEL brands. It operates a fleet of 531 aircraft. The company was incorporated in 2009 and is based in Madrid, Spain.
| Metric | 2023 | 2022 | 2021 | 2020 | 2019 | 2018 | 2017 | 2016 | 2015 | 2014 | 2013 | 2012 | 2011 | 2010 | 2008 | 2007 | 2006 | 2005 | 2004 | 2003 |
|---|---|---|---|---|---|---|---|---|---|---|---|---|---|---|---|---|---|---|---|---|
| Revenue | 29.45B | 23.07B | 8.46B | 7.81B | 25.51B | 24.26B | 22.88B | 22.57B | 22.86B | 20.17B | 18.64B | 18.12B | 16.10B | 7.89B | 9.71B | 10.94B | 12.51B | 11.77B | 11.30B | 11.31B |
| Cost of Revenue | 21.54B | 17.70B | 8.29B | 8.91B | 18.24B | 17.71B | 16.86B | 16.87B | 17.51B | 15.76B | 15.20B | 16.89B | 0.00 | 0.00 | 8.70B | 8.70B | 10.78B | 10.75B | 10.40B | 10.48B |
| Gross Profit | 7.91B | 5.36B | 164.00M | -1.10B | 7.26B | 6.55B | 6.02B | 5.70B | 5.35B | 4.41B | 3.44B | 1.23B | 16.10B | 7.89B | 1.01B | 2.24B | 1.73B | 1.02B | 897.07M | 825.53M |
| Gross Profit Ratio | 26.86% | 23.25% | 1.94% | -14.10% | 28.48% | 26.99% | 26.30% | 25.26% | 23.41% | 21.86% | 18.44% | 6.79% | 100.00% | 100.00% | 10.39% | 20.48% | 13.81% | 8.66% | 7.94% | 7.30% |
| Research & Development | 0.00 | 0.00 | 0.00 | 0.00 | 0.00 | 0.00 | 0.00 | 0.00 | 0.00 | 0.00 | 0.00 | 0.00 | 375.00M | 60.00M | 0.00 | 0.00 | 0.00 | 0.00 | 0.00 | 0.00 |
| General & Administrative | 0.00 | 973.00M | 758.00M | 754.00M | 811.00M | 918.00M | 0.00 | 0.00 | 0.00 | 0.00 | 0.00 | 0.00 | 0.00 | 0.00 | 0.00 | 0.00 | 0.00 | 0.00 | 0.00 | 0.00 |
| Selling & Marketing | 1.16B | 920.00M | 434.00M | 405.00M | 1.04B | 1.05B | 982.00M | 896.00M | 912.00M | 859.00M | 785.00M | 837.00M | 740.00M | 277.00M | 0.00 | 0.00 | 0.00 | 0.00 | 0.00 | 0.00 |
| SG&A | 1.16B | 1.89B | 1.19B | 1.16B | 1.85B | 1.96B | 1.90B | 1.77B | 1.71B | 1.79B | 1.71B | 837.00M | 740.00M | 277.00M | 398.36M | 452.80M | 761.76M | 804.10M | 175.93M | 219.84M |
| Other Expenses | 3.25B | 0.00 | 0.00 | -70.51M | 0.00 | 0.00 | 0.00 | 0.00 | 0.00 | 0.00 | 0.00 | 2.34B | 14.37B | 7.19B | -631.55M | 4.37B | 0.00 | 804.10M | 175.93M | 0.00 |
| Operating Expenses | 4.40B | 4.02B | 2.91B | 6.11B | 4.43B | 2.86B | 3.34B | 3.09B | 3.30B | 3.37B | 2.96B | 1.84B | 15.49B | 7.53B | 1.03B | -3.92B | 761.76M | 1.61B | 351.85M | 219.84M |
| Cost & Expenses | 25.95B | 21.72B | 11.20B | 15.02B | 22.67B | 20.57B | 20.20B | 19.96B | 20.80B | 19.13B | 18.16B | 18.73B | 15.49B | 7.53B | 9.73B | 4.78B | 11.55B | 10.75B | 10.40B | 10.70B |
| Interest Income | 471.00M | 928.00M | 763.00M | 616.00M | 560.00M | 198.00M | 196.00M | 245.00M | 253.00M | 216.00M | 253.00M | 53.00M | 269.00M | 21.00M | 102.56M | 139.23M | 190.07M | 131.87M | 120.68M | 94.22M |
| Interest Expense | 1.10B | 979.00M | 768.00M | 637.00M | 607.00M | 231.00M | 224.00M | 278.00M | 295.00M | 248.00M | 284.00M | 259.00M | 196.00M | 189.00M | 182.45M | 220.76M | 251.96M | 309.60M | 385.29M | 382.85M |
| Depreciation & Amortization | 801.00M | 805.00M | 691.00M | 774.00M | 827.00M | 1.13B | 1.07B | 1.27B | 1.30B | 1.19B | 995.00M | 1.41B | 969.00M | 671.00M | 743.83M | 867.97M | 1.05B | 1.04B | 1.05B | 1.02B |
| EBITDA | 4.44B | 2.20B | -2.25B | -5.08B | 4.13B | 4.46B | 4.01B | 3.93B | 3.64B | 2.62B | 1.73B | 537.00M | 1.75B | 1.06B | 722.23M | 7.03B | 2.02B | 2.06B | 1.95B | 1.62B |
| EBITDA Ratio | 15.06% | 9.52% | -26.65% | -45.66% | 16.20% | 18.39% | 17.53% | 17.43% | 15.92% | 13.00% | 9.28% | 3.76% | 10.95% | 13.01% | 7.44% | 64.25% | 16.16% | 17.51% | 17.24% | 14.34% |
| Operating Income | 3.51B | 1.39B | -2.94B | -4.34B | 3.30B | 3.33B | 2.94B | 2.66B | 2.34B | 1.44B | 734.00M | -613.00M | 522.00M | 418.00M | -21.59M | 6.16B | 966.57M | 1.02B | 897.07M | 605.69M |
| Operating Income Ratio | 11.91% | 6.03% | -34.82% | -55.57% | 12.95% | 13.73% | 12.83% | 11.79% | 10.23% | 7.11% | 3.94% | -3.38% | 3.24% | 5.30% | -0.22% | 56.32% | 7.72% | 8.66% | 7.94% | 5.36% |
| Total Other Income/Expenses | -451.00M | -863.00M | -742.00M | -376.00M | -338.00M | -191.00M | -181.00M | -122.00M | -517.00M | -201.00M | -300.00M | -161.00M | 20.00M | -217.00M | -415.64M | -5.04B | -73.67M | -176.30M | -186.10M | -336.49M |
| Income Before Tax | 3.06B | 415.00M | -3.51B | -7.83B | 2.28B | 3.49B | 2.48B | 2.36B | 1.80B | 828.00M | 227.00M | -997.00M | 542.00M | 201.00M | -437.23M | 1.12B | 892.90M | 842.80M | 710.97M | 269.19M |
| Income Before Tax Ratio | 10.38% | 1.80% | -41.48% | -100.27% | 8.92% | 14.37% | 10.84% | 10.47% | 7.88% | 4.11% | 1.22% | -5.50% | 3.37% | 2.55% | -4.50% | 10.27% | 7.14% | 7.16% | 6.29% | 2.38% |
| Income Tax Expense | 401.00M | 16.00M | 574.00M | 892.00M | 560.00M | 590.00M | 472.00M | 410.00M | 285.00M | 175.00M | 76.00M | -112.00M | -40.00M | -11.00M | -46.42M | 243.33M | 254.90M | 217.87M | 175.93M | 98.70M |
| Net Income | 2.66B | 431.00M | -2.93B | -6.94B | 1.72B | 2.89B | 1.99B | 1.93B | 1.50B | 982.00M | 126.00M | -943.00M | 562.00M | 197.00M | -404.84M | 893.06M | 624.73M | 646.43M | 548.13M | 194.42M |
| Net Income Ratio | 9.01% | 1.87% | -34.69% | -88.84% | 6.72% | 11.89% | 8.69% | 8.56% | 6.54% | 4.87% | 0.68% | -5.21% | 3.49% | 2.50% | -4.17% | 8.16% | 4.99% | 5.49% | 4.85% | 1.72% |
| EPS | 0.51 | 0.09 | -0.59 | -1.97 | 0.86 | 1.37 | 0.95 | 0.93 | 0.73 | 0.48 | 0.07 | -0.51 | 0.31 | 0.17 | -0.23 | 0.51 | 0.36 | 0.38 | 0.34 | 0.12 |
| EPS Diluted | 0.50 | 0.06 | -0.59 | -1.97 | 0.84 | 1.37 | 0.92 | 0.89 | 0.70 | 0.46 | 0.07 | -0.46 | 0.30 | 0.17 | -0.23 | 0.51 | 0.36 | 0.38 | 0.32 | 0.12 |
| Weighted Avg Shares Out | 5.25B | 4.96B | 4.96B | 3.53B | 2.03B | 2.10B | 2.16B | 2.18B | 2.12B | 2.12B | 1.94B | 1.85B | 1.81B | 1.15B | 1.74B | 1.74B | 1.72B | 1.68B | 1.62B | 1.61B |
| Weighted Avg Shares Out (Dil) | 5.28B | 5.34B | 4.96B | 3.53B | 2.07B | 2.11B | 2.18B | 2.21B | 2.16B | 2.16B | 1.95B | 2.07B | 2.01B | 1.15B | 1.74B | 1.75B | 1.74B | 1.72B | 1.70B | 1.61B |

Should Value Investors Buy International Consolidated Airlines Group (ICAGY) Stock?
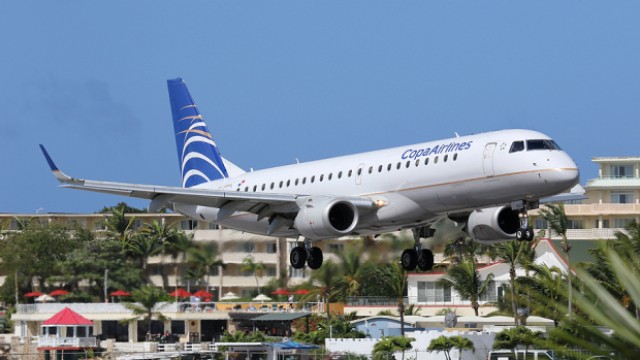
3 Airline Stocks to Bet On Post IATA's Bullish 2024 View

British Airways takes on staff ahead of summer rush and IT upgrade
British Airways owner hit as transatlantic partner cuts forecasts
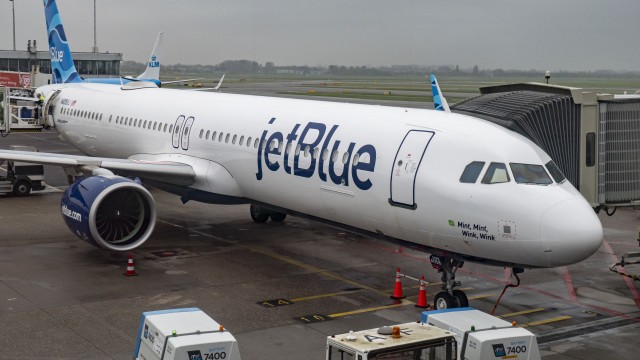
JetBlue, British Airways seek partnership to expand networks
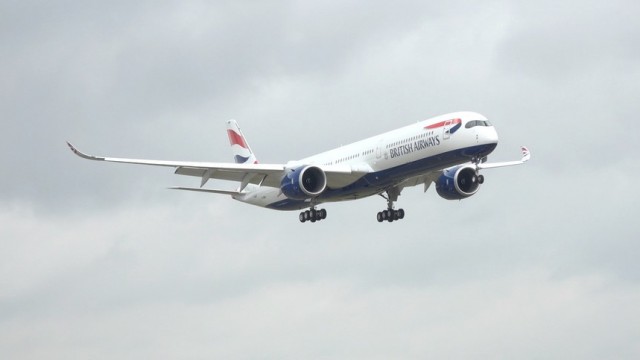
British Airways owner IAG tipped to outperform
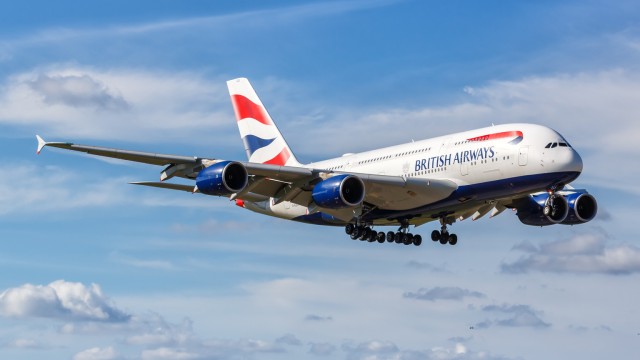
International Consolidated Airlines Group Stock Remains A Buy

International Consolidated Airlines Group S.A. (ICAGY) Q1 2024 Earnings Call Transcript
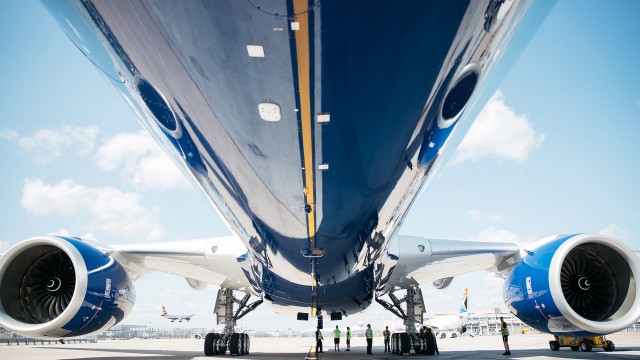
British Airways owner IAG wins seal of approval from City analysts
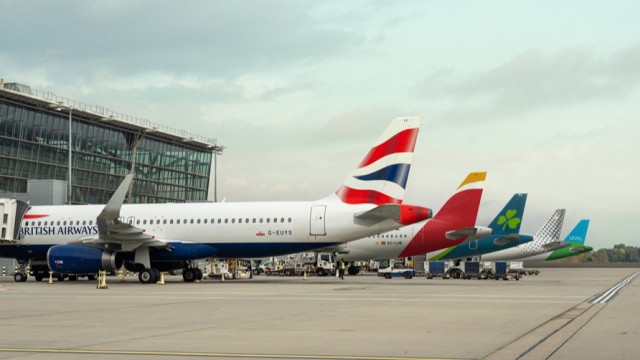
British Airways owner IAG lands solid first-quarter results
Source: https://incomestatements.info
Category: Stock Reports
