See more : PT Perintis Triniti Properti Tbk (TRIN.JK) Income Statement Analysis – Financial Results
Complete financial analysis of International Consolidated Airlines Group S.A. (ICAGY) income statement, including revenue, profit margins, EPS and key performance metrics. Get detailed insights into the financial performance of International Consolidated Airlines Group S.A., a leading company in the Airlines, Airports & Air Services industry within the Industrials sector.
- Shenzhen Crastal Technology Co.,Ltd (300824.SZ) Income Statement Analysis – Financial Results
- The Edinburgh Investment Trust plc (EDIN.L) Income Statement Analysis – Financial Results
- PT Djasa Ubersakti Tbk (PTDU.JK) Income Statement Analysis – Financial Results
- Taboola.com, Ltd. (TBLAW) Income Statement Analysis – Financial Results
- Blue Note Mining Inc. (BLNMF) Income Statement Analysis – Financial Results
International Consolidated Airlines Group S.A. (ICAGY)
About International Consolidated Airlines Group S.A.
International Consolidated Airlines Group, S.A., together with its subsidiaries, engages in the provision of passenger and cargo transportation services in the United Kingdom, Spain, Ireland, the United States, and rest of the world. The company operates under the British Airways, Iberia, Vueling, Aer Lingus, and LEVEL brands. It operates a fleet of 531 aircraft. The company was incorporated in 2009 and is based in Madrid, Spain.
| Metric | 2023 | 2022 | 2021 | 2020 | 2019 | 2018 | 2017 | 2016 | 2015 | 2014 | 2013 | 2012 | 2011 | 2010 | 2008 | 2007 | 2006 | 2005 | 2004 | 2003 |
|---|---|---|---|---|---|---|---|---|---|---|---|---|---|---|---|---|---|---|---|---|
| Revenue | 29.45B | 23.07B | 8.46B | 7.81B | 25.51B | 24.26B | 22.88B | 22.57B | 22.86B | 20.17B | 18.64B | 18.12B | 16.10B | 7.89B | 9.71B | 10.94B | 12.51B | 11.77B | 11.30B | 11.31B |
| Cost of Revenue | 21.54B | 17.70B | 8.29B | 8.91B | 18.24B | 17.71B | 16.86B | 16.87B | 17.51B | 15.76B | 15.20B | 16.89B | 0.00 | 0.00 | 8.70B | 8.70B | 10.78B | 10.75B | 10.40B | 10.48B |
| Gross Profit | 7.91B | 5.36B | 164.00M | -1.10B | 7.26B | 6.55B | 6.02B | 5.70B | 5.35B | 4.41B | 3.44B | 1.23B | 16.10B | 7.89B | 1.01B | 2.24B | 1.73B | 1.02B | 897.07M | 825.53M |
| Gross Profit Ratio | 26.86% | 23.25% | 1.94% | -14.10% | 28.48% | 26.99% | 26.30% | 25.26% | 23.41% | 21.86% | 18.44% | 6.79% | 100.00% | 100.00% | 10.39% | 20.48% | 13.81% | 8.66% | 7.94% | 7.30% |
| Research & Development | 0.00 | 0.00 | 0.00 | 0.00 | 0.00 | 0.00 | 0.00 | 0.00 | 0.00 | 0.00 | 0.00 | 0.00 | 375.00M | 60.00M | 0.00 | 0.00 | 0.00 | 0.00 | 0.00 | 0.00 |
| General & Administrative | 0.00 | 973.00M | 758.00M | 754.00M | 811.00M | 918.00M | 0.00 | 0.00 | 0.00 | 0.00 | 0.00 | 0.00 | 0.00 | 0.00 | 0.00 | 0.00 | 0.00 | 0.00 | 0.00 | 0.00 |
| Selling & Marketing | 1.16B | 920.00M | 434.00M | 405.00M | 1.04B | 1.05B | 982.00M | 896.00M | 912.00M | 859.00M | 785.00M | 837.00M | 740.00M | 277.00M | 0.00 | 0.00 | 0.00 | 0.00 | 0.00 | 0.00 |
| SG&A | 1.16B | 1.89B | 1.19B | 1.16B | 1.85B | 1.96B | 1.90B | 1.77B | 1.71B | 1.79B | 1.71B | 837.00M | 740.00M | 277.00M | 398.36M | 452.80M | 761.76M | 804.10M | 175.93M | 219.84M |
| Other Expenses | 3.25B | 0.00 | 0.00 | -70.51M | 0.00 | 0.00 | 0.00 | 0.00 | 0.00 | 0.00 | 0.00 | 2.34B | 14.37B | 7.19B | -631.55M | 4.37B | 0.00 | 804.10M | 175.93M | 0.00 |
| Operating Expenses | 4.40B | 4.02B | 2.91B | 6.11B | 4.43B | 2.86B | 3.34B | 3.09B | 3.30B | 3.37B | 2.96B | 1.84B | 15.49B | 7.53B | 1.03B | -3.92B | 761.76M | 1.61B | 351.85M | 219.84M |
| Cost & Expenses | 25.95B | 21.72B | 11.20B | 15.02B | 22.67B | 20.57B | 20.20B | 19.96B | 20.80B | 19.13B | 18.16B | 18.73B | 15.49B | 7.53B | 9.73B | 4.78B | 11.55B | 10.75B | 10.40B | 10.70B |
| Interest Income | 471.00M | 928.00M | 763.00M | 616.00M | 560.00M | 198.00M | 196.00M | 245.00M | 253.00M | 216.00M | 253.00M | 53.00M | 269.00M | 21.00M | 102.56M | 139.23M | 190.07M | 131.87M | 120.68M | 94.22M |
| Interest Expense | 1.10B | 979.00M | 768.00M | 637.00M | 607.00M | 231.00M | 224.00M | 278.00M | 295.00M | 248.00M | 284.00M | 259.00M | 196.00M | 189.00M | 182.45M | 220.76M | 251.96M | 309.60M | 385.29M | 382.85M |
| Depreciation & Amortization | 801.00M | 805.00M | 691.00M | 774.00M | 827.00M | 1.13B | 1.07B | 1.27B | 1.30B | 1.19B | 995.00M | 1.41B | 969.00M | 671.00M | 743.83M | 867.97M | 1.05B | 1.04B | 1.05B | 1.02B |
| EBITDA | 4.44B | 2.20B | -2.25B | -5.08B | 4.13B | 4.46B | 4.01B | 3.93B | 3.64B | 2.62B | 1.73B | 537.00M | 1.75B | 1.06B | 722.23M | 7.03B | 2.02B | 2.06B | 1.95B | 1.62B |
| EBITDA Ratio | 15.06% | 9.52% | -26.65% | -45.66% | 16.20% | 18.39% | 17.53% | 17.43% | 15.92% | 13.00% | 9.28% | 3.76% | 10.95% | 13.01% | 7.44% | 64.25% | 16.16% | 17.51% | 17.24% | 14.34% |
| Operating Income | 3.51B | 1.39B | -2.94B | -4.34B | 3.30B | 3.33B | 2.94B | 2.66B | 2.34B | 1.44B | 734.00M | -613.00M | 522.00M | 418.00M | -21.59M | 6.16B | 966.57M | 1.02B | 897.07M | 605.69M |
| Operating Income Ratio | 11.91% | 6.03% | -34.82% | -55.57% | 12.95% | 13.73% | 12.83% | 11.79% | 10.23% | 7.11% | 3.94% | -3.38% | 3.24% | 5.30% | -0.22% | 56.32% | 7.72% | 8.66% | 7.94% | 5.36% |
| Total Other Income/Expenses | -451.00M | -863.00M | -742.00M | -376.00M | -338.00M | -191.00M | -181.00M | -122.00M | -517.00M | -201.00M | -300.00M | -161.00M | 20.00M | -217.00M | -415.64M | -5.04B | -73.67M | -176.30M | -186.10M | -336.49M |
| Income Before Tax | 3.06B | 415.00M | -3.51B | -7.83B | 2.28B | 3.49B | 2.48B | 2.36B | 1.80B | 828.00M | 227.00M | -997.00M | 542.00M | 201.00M | -437.23M | 1.12B | 892.90M | 842.80M | 710.97M | 269.19M |
| Income Before Tax Ratio | 10.38% | 1.80% | -41.48% | -100.27% | 8.92% | 14.37% | 10.84% | 10.47% | 7.88% | 4.11% | 1.22% | -5.50% | 3.37% | 2.55% | -4.50% | 10.27% | 7.14% | 7.16% | 6.29% | 2.38% |
| Income Tax Expense | 401.00M | 16.00M | 574.00M | 892.00M | 560.00M | 590.00M | 472.00M | 410.00M | 285.00M | 175.00M | 76.00M | -112.00M | -40.00M | -11.00M | -46.42M | 243.33M | 254.90M | 217.87M | 175.93M | 98.70M |
| Net Income | 2.66B | 431.00M | -2.93B | -6.94B | 1.72B | 2.89B | 1.99B | 1.93B | 1.50B | 982.00M | 126.00M | -943.00M | 562.00M | 197.00M | -404.84M | 893.06M | 624.73M | 646.43M | 548.13M | 194.42M |
| Net Income Ratio | 9.01% | 1.87% | -34.69% | -88.84% | 6.72% | 11.89% | 8.69% | 8.56% | 6.54% | 4.87% | 0.68% | -5.21% | 3.49% | 2.50% | -4.17% | 8.16% | 4.99% | 5.49% | 4.85% | 1.72% |
| EPS | 0.51 | 0.09 | -0.59 | -1.97 | 0.86 | 1.37 | 0.95 | 0.93 | 0.73 | 0.48 | 0.07 | -0.51 | 0.31 | 0.17 | -0.23 | 0.51 | 0.36 | 0.38 | 0.34 | 0.12 |
| EPS Diluted | 0.50 | 0.06 | -0.59 | -1.97 | 0.84 | 1.37 | 0.92 | 0.89 | 0.70 | 0.46 | 0.07 | -0.46 | 0.30 | 0.17 | -0.23 | 0.51 | 0.36 | 0.38 | 0.32 | 0.12 |
| Weighted Avg Shares Out | 5.25B | 4.96B | 4.96B | 3.53B | 2.03B | 2.10B | 2.16B | 2.18B | 2.12B | 2.12B | 1.94B | 1.85B | 1.81B | 1.15B | 1.74B | 1.74B | 1.72B | 1.68B | 1.62B | 1.61B |
| Weighted Avg Shares Out (Dil) | 5.28B | 5.34B | 4.96B | 3.53B | 2.07B | 2.11B | 2.18B | 2.21B | 2.16B | 2.16B | 1.95B | 2.07B | 2.01B | 1.15B | 1.74B | 1.75B | 1.74B | 1.72B | 1.70B | 1.61B |
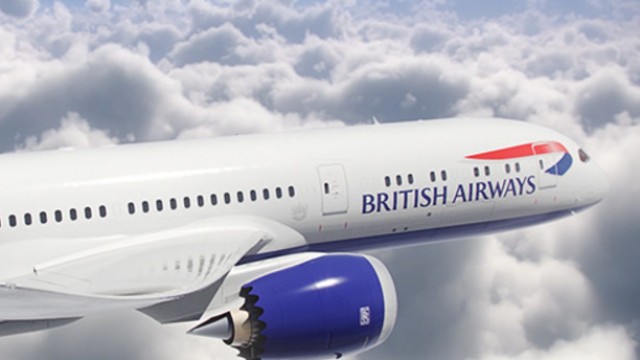
British Airways owner's acquisition of Air Europa facing more regulatory turbulence
British Airways owner's acquisition of Air Europa facing more regulatory turbulence
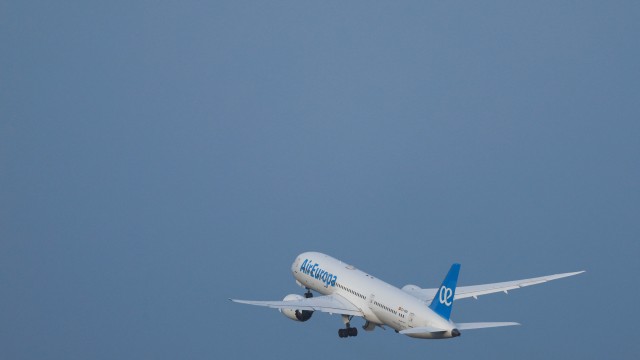
Exclusive: EU regulators have not sought feedback on IAG's Air Europa deal, sources say

International Consolidated Airlines Group SA (ICAGY)'s Technical Outlook is Bright After Key Golden Cross

International Consolidated Airlines Group Poised For Takeoff With Strong Financials
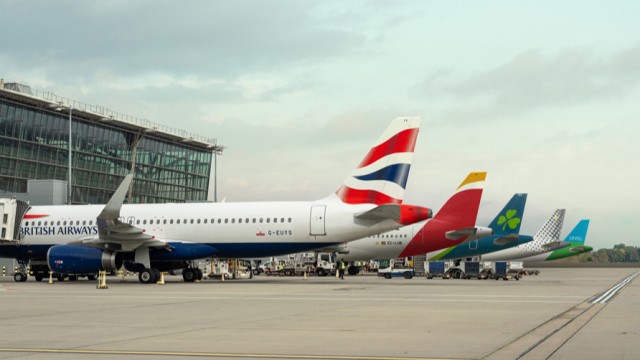
British Airways owner IAG's results could be 'catalyst' for rerating - analyst

International Consolidated Airlines: Better And Cheaper Post-COVID
IAG flags Air Europa's customers personal data leak, WSJ reports

Is International Consolidated Airlines Group (ICAGY) Stock Undervalued Right Now?
Californian Firm And British Airways Owner IAG Ink ‘Largest' Deal For Sustainable Aviation Fuel
Source: https://incomestatements.info
Category: Stock Reports
