See more : TE Connectivity Ltd. (TEL) Income Statement Analysis – Financial Results
Complete financial analysis of Marvel Discovery Corp. (MARVF) income statement, including revenue, profit margins, EPS and key performance metrics. Get detailed insights into the financial performance of Marvel Discovery Corp., a leading company in the Industrial Materials industry within the Basic Materials sector.
- Vahanna Tech Edge Acquisition I Corp. (VHNAW) Income Statement Analysis – Financial Results
- Consolidated Finvest & Holdings Limited (CONSOFINVT.NS) Income Statement Analysis – Financial Results
- Bonterra Resources Inc. (BTR.V) Income Statement Analysis – Financial Results
- Vitrolife AB (publ) (VTRLY) Income Statement Analysis – Financial Results
- Huatai Securities Co., Ltd. (HUATF) Income Statement Analysis – Financial Results
Marvel Discovery Corp. (MARVF)
About Marvel Discovery Corp.
Marvel Discovery Corp. engages in the acquisition, exploration, and development of mineral properties in Canada. The company has an option to acquire a 100% interest in the Duhamel Property consists of nine mineral claims covering an area of approximately 500 hectares located northwest of the city of the Saguenay, Quebec; the Wicheeda North project comprises 18 claims that covers 4,423.8 hectares situated Northeast of Prince George, British Columbia; and the Blackfly property that includes five claims consisting of 64 unpatented mining claims located in Atikokan, Ontario. It also has an option to acquire a 100% interest in Slip Gold property consists of six claims with 264 claim units situated in Newfoundland; the Victoria/Long Lake comprises five claims with 53 claim units located in Newfoundland; the East Bull property, which includes 16 mineral claims situated in the Deagle, Gaiashk, and Gerow mining district, Ontario; and the Sandy Pond and Baie Verte Line property comprising 335 mineral claims located in the Province of Newfoundland and Labrador, as well as holds interest in Gander South project comprises 14 mineral claims situated in Newfoundland. In addition, Marvel Discovery Corp. has an option to acquire a 100% interest in the Highway North property consists of five contiguous claims totaling 2,573 hectares located in the Athabasca region of Saskatchewan. The company was formerly known as International Montoro Resources Inc. and changed its name to Marvel Discovery Corp. in February 2021. Marvel Discovery Corp. was incorporated in 1987 and is headquartered in Vancouver, Canada.
| Metric | 2023 | 2022 | 2021 | 2020 | 2019 | 2018 | 2017 | 2016 | 2015 | 2014 | 2013 | 2012 | 2011 | 2010 | 2009 | 2008 | 2007 | 2006 | 2005 | 2004 | 2003 | 2002 |
|---|---|---|---|---|---|---|---|---|---|---|---|---|---|---|---|---|---|---|---|---|---|---|
| Revenue | 0.00 | 0.00 | 0.00 | 0.00 | 0.00 | 0.00 | 0.00 | 0.00 | 0.00 | 0.00 | 0.00 | 0.00 | 0.00 | 0.00 | 0.00 | 0.00 | 0.00 | 0.00 | 0.00 | 0.00 | 0.00 | 0.00 |
| Cost of Revenue | 0.00 | 12.00 | 0.00 | 0.00 | 0.00 | 0.00 | 0.00 | 0.00 | 0.00 | 140.00 | 453.00 | 0.00 | 0.00 | 0.00 | 0.00 | 0.00 | 0.00 | 0.00 | 0.00 | 0.00 | 0.00 | 0.00 |
| Gross Profit | 0.00 | -12.00 | 0.00 | 0.00 | 0.00 | 0.00 | 0.00 | 0.00 | 0.00 | -140.00 | -453.00 | 0.00 | 0.00 | 0.00 | 0.00 | 0.00 | 0.00 | 0.00 | 0.00 | 0.00 | 0.00 | 0.00 |
| Gross Profit Ratio | 0.00% | 0.00% | 0.00% | 0.00% | 0.00% | 0.00% | 0.00% | 0.00% | 0.00% | 0.00% | 0.00% | 0.00% | 0.00% | 0.00% | 0.00% | 0.00% | 0.00% | 0.00% | 0.00% | 0.00% | 0.00% | 0.00% |
| Research & Development | 0.00 | 0.00 | 0.00 | 0.00 | 0.00 | 0.00 | 0.00 | 0.00 | 0.00 | 0.00 | 0.00 | 0.00 | 0.00 | 0.00 | 0.00 | 0.00 | 0.00 | 0.00 | 0.00 | 0.00 | 0.00 | 0.00 |
| General & Administrative | 250.66K | 679.78K | 925.74K | 468.92K | 341.31K | 344.29K | 155.63K | 282.55K | 408.39K | 373.81K | 138.34K | 201.87K | 417.83K | 337.77K | 220.77K | 0.00 | 0.00 | 0.00 | 0.00 | 0.00 | 0.00 | 0.00 |
| Selling & Marketing | 9.43K | 9.42K | 0.00 | 58.45K | 92.43K | 22.85K | 8.58K | 47.06K | 0.00 | 31.65K | 1.51K | 43.30K | 74.63K | 76.80K | 101.78K | 0.00 | 0.00 | 0.00 | 0.00 | 0.00 | 0.00 | 0.00 |
| SG&A | 260.08K | 679.78K | 925.74K | 468.92K | 341.31K | 344.29K | 155.63K | 282.55K | 408.39K | 373.81K | 138.34K | 245.17K | 492.46K | 414.57K | 322.55K | 499.69K | 607.43K | 214.79K | 91.25K | 203.49K | 88.97K | 74.50K |
| Other Expenses | 154.83K | 65.28K | 72.00K | -3.68K | 0.00 | 0.00 | 0.00 | 0.00 | 0.00 | 0.00 | 0.00 | 0.00 | 0.00 | 0.00 | 1.97M | 0.00 | 0.00 | 0.00 | 0.00 | 0.00 | 0.00 | 0.00 |
| Operating Expenses | 433.81K | 691.78K | 925.74K | 468.92K | 341.31K | 347.54K | 155.63K | 282.55K | 408.49K | 375.67K | 138.79K | 245.57K | 493.88K | 414.88K | 322.99K | -1.43M | 608.45K | 214.79K | 91.25K | 203.49K | 88.97K | 74.50K |
| Cost & Expenses | 433.81K | 691.78K | 925.74K | 468.92K | 341.31K | 347.54K | 155.63K | 282.55K | 408.49K | 375.81K | 138.79K | 245.57K | 493.88K | 414.88K | 322.99K | -1.43M | 608.45K | 214.79K | 91.25K | 203.49K | 88.97K | 74.50K |
| Interest Income | 3.29K | 1.61K | 742.00 | 0.00 | 0.00 | 0.00 | 0.00 | 0.00 | 0.00 | 0.00 | 0.00 | 0.00 | 0.00 | 13.00 | 38.00 | 0.00 | 0.00 | 0.00 | 0.00 | 0.00 | 0.00 | 0.00 |
| Interest Expense | 1.63K | 3.27K | 21.06K | 38.11K | 32.45K | 44.24K | 43.90K | 35.03K | 19.74K | 6.98K | 236.00 | 538.00 | 684.00 | 977.00 | 1.02K | 0.00 | 0.00 | 0.00 | 0.00 | 0.00 | 0.00 | 0.00 |
| Depreciation & Amortization | 26.57K | 497.37K | 105.17K | 1.00 | 1.00 | 11.25K | 11.25K | 92.18K | 99.00 | 140.00 | 453.00 | 394.00 | 358.00 | 306.00 | 439.00 | 258.00 | 0.00 | 140.80K | 0.00 | 0.00 | 0.00 | 0.00 |
| EBITDA | -407.24K | 0.00 | -853.00K | -436.82K | -303.89K | -301.63K | -133.58K | -282.55K | -380.33K | -375.67K | -138.34K | -245.17K | -493.52K | -414.56K | -322.47K | 3.36M | -608.45K | -144.39K | -91.25K | -203.49K | -88.97K | -74.50K |
| EBITDA Ratio | 0.00% | 0.00% | 0.00% | 0.00% | 0.00% | 0.00% | 0.00% | 0.00% | 0.00% | 0.00% | 0.00% | 0.00% | 0.00% | 0.00% | 0.00% | 0.00% | 0.00% | 0.00% | 0.00% | 0.00% | 0.00% | 0.00% |
| Operating Income | -433.81K | -624.89K | -853.00K | -468.92K | -341.31K | -347.54K | -155.63K | -282.55K | -408.49K | -375.81K | -138.79K | -245.57K | -494.57K | -415.85K | -323.96K | -499.69K | -608.45K | -285.19K | -91.25K | -203.49K | -88.97K | -74.50K |
| Operating Income Ratio | 0.00% | 0.00% | 0.00% | 0.00% | 0.00% | 0.00% | 0.00% | 0.00% | 0.00% | 0.00% | 0.00% | 0.00% | 0.00% | 0.00% | 0.00% | 0.00% | 0.00% | 0.00% | 0.00% | 0.00% | 0.00% | 0.00% |
| Total Other Income/Expenses | -263.42K | -311.48K | -102.23K | -73.89K | -69.87K | -57.65K | -59.76K | -127.38K | -23.55K | -424.45K | -206.59K | -15.42K | 119.82K | 9.61K | -985.49K | -1.92M | -37.81K | 572.20K | 0.00 | 0.00 | 0.00 | -600.00 |
| Income Before Tax | -697.23K | -808.85K | -835.48K | -510.71K | -373.76K | -370.53K | -193.34K | -409.93K | -432.04K | -800.26K | -345.39K | -260.99K | -374.07K | -406.24K | -1.31M | -2.42M | -646.25K | 287.01K | 0.00 | 0.00 | 0.00 | -75.10K |
| Income Before Tax Ratio | 0.00% | 0.00% | 0.00% | 0.00% | 0.00% | 0.00% | 0.00% | 0.00% | 0.00% | 0.00% | 0.00% | 0.00% | 0.00% | 0.00% | 0.00% | 0.00% | 0.00% | 0.00% | 0.00% | 0.00% | 0.00% | 0.00% |
| Income Tax Expense | 31.44K | 1.93 | 92.95K | 38.11K | 32.45K | 3.25K | 43.88K | 34.94K | 19.74K | 6.98K | 236.00 | 538.00 | -12.94K | 977.00 | -2.41K | -146.15K | 0.00 | -53.06K | 92.80K | 209.05K | 79.92K | 694.00 |
| Net Income | -728.67K | -808.85K | -835.48K | -510.71K | -373.76K | -370.53K | -193.34K | -409.93K | -432.04K | -800.26K | -345.39K | -260.99K | -361.13K | -406.24K | -1.31M | -2.28M | -646.25K | -233.95K | -92.80K | -209.05K | -79.92K | -75.79K |
| Net Income Ratio | 0.00% | 0.00% | 0.00% | 0.00% | 0.00% | 0.00% | 0.00% | 0.00% | 0.00% | 0.00% | 0.00% | 0.00% | 0.00% | 0.00% | 0.00% | 0.00% | 0.00% | 0.00% | 0.00% | 0.00% | 0.00% | 0.00% |
| EPS | -0.01 | -0.01 | -0.01 | -0.01 | -0.01 | -0.02 | -0.01 | -0.03 | -0.03 | -0.07 | -0.03 | -0.02 | -0.03 | -0.05 | -0.24 | -0.56 | -0.27 | -0.27 | -0.02 | -0.05 | -0.02 | -0.02 |
| EPS Diluted | -0.01 | -0.01 | -0.01 | -0.01 | -0.01 | -0.02 | -0.01 | -0.03 | -0.03 | -0.07 | -0.03 | -0.02 | -0.03 | -0.05 | -0.24 | -0.56 | -0.27 | -0.27 | -0.02 | -0.05 | -0.02 | -0.02 |
| Weighted Avg Shares Out | 114.91M | 91.02M | 68.86M | 44.70M | 31.77M | 22.18M | 15.08M | 14.39M | 12.93M | 11.49M | 11.32M | 11.21M | 10.38M | 8.13M | 5.53M | 4.03M | 2.44M | 867.51K | 4.34M | 3.87M | 3.25M | 3.06M |
| Weighted Avg Shares Out (Dil) | 114.91M | 91.02M | 68.86M | 44.70M | 31.77M | 22.18M | 15.08M | 14.39M | 12.93M | 11.49M | 11.32M | 11.21M | 10.38M | 8.13M | 5.53M | 4.03M | 2.44M | 867.51K | 4.34M | 3.87M | 3.25M | 3.06M |

Marvel Receives First Set of Drill Permits at Houliere-Duhamel Nickel-Copper-Cobalt Property, Lac St. Jean, QC
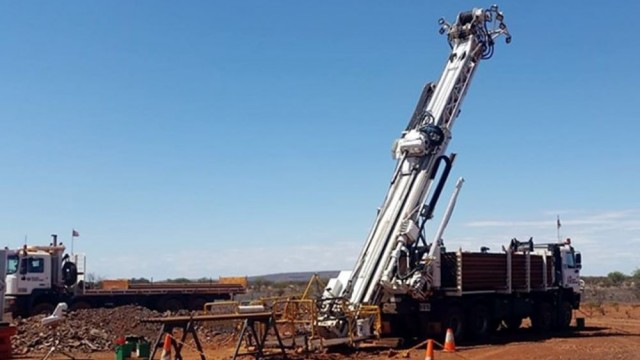
Marvel Discovery says JV partner applies for drill permits for Golden Brook prospects

Marvel Discovery bolsters board with veteran geologist Peter Born

Marvel Discovery, Announces Appointment of Dr. Peter Born to the Board of Directors
Marvel Discovery announces follow-up drill program at KLR-Walker uranium project

Falcon Gold and Marvel Discovery option Newfoundland property to Carmanah minerals for rare earth exploration
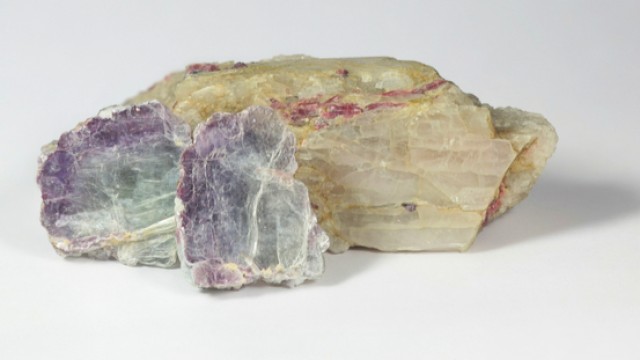
Marvel Discovery and Falcon Gold continue to grow their lithium exploration alliance

Marvel Discovery CEO sees similarities between its KLR project and Nexgen's Arrow deposit,
Marvel Discovery and Falcon Gold report evidence of pegmatites at Hope Brook lithium prospect

Marvel Discovery completes first diamond drilling program at the DD and Highway Zone in the KLR-Walker Uranium Project
Source: https://incomestatements.info
Category: Stock Reports
